IPUMS Forum Replies
The IPUMS forum forum.ipums.org is an online resource where researchers can post and search for answers to questions about using IPUMS. I've collected my responses across different categories below.
2026 · 66 replies
2026-09-17 · USA
The IPUMS data team is currently working on re-releasing PLACENHG which will map 1940 city codes (in the 1940 full count data) to modern Census FIPS codes. Specifically, PLACENHG will combine a state FIPS code with a place FIPS to form a nationally unique ID. Cities in 1940 without a modern FIPS will receive a pseudo FIPS code instead. This variable will be part of a forthcoming release on IPUMS USA. Once it is available, the revision history will be updated to reflect this change. If you require the data urgently, you may email our user support team directly at ipums@umn.edu and I will share the preliminary crosswalk between PLACENHG and CITY codes.
While PLACENHG will only be available in the 1940 full count, it will be possible to use a data extract to create a crosswalk between PLACENHG and the harmonized variable CITY. Such a crosswalk can then be used to assign PLACENHG codes to cities in other samples as long as the corresponding CITY is identified in the 1940 data. For reference, a bit fewer than 5% of cities identified in 1950 do not have a 1940 code and a bit more than 5% of cities identified in 1930 do not have a corresponding 1940 code.
2026-09-17 · ipumsr
I’m sorry to hear that you are getting this error.
I am currently able to submit extract requests using the API and receive the data file without any issues. Could you share your API call and the specific error message you are receiving with our user support team directly at ipums@umn.edu? I’ll be able to more easily help troubleshoot what’s causing this issue.
2026-09-14 · CPS
WTFINL is the correct weight to use for (un)employment estimates by occupation and the weight should be divided by the total number of months in your analytical sample.
The approach for strata identification you have outlined is consistent with the recommendation from Davern et al. (2007). I will note that when using the smallest identifiable geographic unit (PLACEFIPS) as the stratum, many households will end up in the STATEFIP remainder. You might therefore add COUNTY as an intermediate stratum identifier. Households without an identified PLACEFIPS but with an identified COUNTY get their own stratum and only those with neither would fall back to state. Note that PLACEFIPS should always be combined with STATEFIP to uniquely identify cities. Additionally, in a cascading approach like this, it may make sense to restrict strata to only COUNTY and PLACEFIPS codes that appear across all vintages. A code that gets dropped or added later splits the same area across the three tiers, which can leave a stratum with too few PSUs and understate the error term. Since PLACEFIPS codes (in combination with STATEFIP) are unique across vintages (i.e., the same place should have the same code across vintages), there is no change in codes over time that needs to be accounted for.
On the choice of PSU, I would revise my recommendation and suggest using the unique household identifier CPSID rather than YEAR + MONTH + SERIAL in order to incorporate the rotating panel structure of the CPS. This adjusts intervals for the repeated sampling that you have noted.
2026-09-11 · Global Health
Due to the large number of variables and samples across the DHS surveys, it is sometimes the case that variables included in one IPUMS DHS data release are not provided in a subsequent release even if the underlying DHS data is available. This appears to be the case with the household interview time variables that you mention. I have shared your interest in these variables with my colleagues so that they can looking into including these in the next data release.
You are correct that the data for these variables in the Cameroon 2018 survey are available directly through the DHS Program website. It is relatively straightforward to link records from the DHS Program data to IPUMS DHS. This user note outlines this process; for linking household records, the variable IDHSHID can be matched against a concatenation of the DHS Program variables SAMPLE ID and HHID.
2026-09-04 · USA
Thank you for helping clarify this revision note. You are correct that the previous issue with inflation adjustment in the 2019-2023 5-year ACS was that each survey year had received the following year’s adjustment factor for converting to 2023 dollars.
For example, monetary values from the 2021 data were previously being adjusted by a factor 1.04125 for the purpose of converting these to 2023 dollars. However, 1.04125 is not the correct factor for converting 2021 values to either 2022 or 2023 dollars; it is instead the correct factor for converting 2022 values to 2023 dollars. Similarly, the adjustment factor for converting 2021 values to 2023 dollars was being incorrectly applied to 2020 values, and so on. Additionally, no adjustment factor was being applied to 2023 data (which is why it appears unchanged in your table).
I will connect with my colleagues to see if we can edit the revision history note to more clearly explain this. Thank you for sharing your findings so that other users can be aware of how the data was revised to fix this error.
2026-09-01 · USA · marked as solution
The differences that you are finding between the published estimates and those in the Public Use Microdata Sample (PUMS) are within the expected range. As a reference, I pulled up Table B12002: “Sex by Marital Status for the Population 15 Years and Over” for 2024 (on census.data.gov) and selected estimates and margins of error for Alabama PUMAs. In the screenshot below the margins of error are well above the discrepancies that you are finding.
These differences are due to the published estimates being drawn from a larger internal file than the PUMS. It’s also worth noting that both figures are estimates that are affected by sampling variability and nonsampling error. The ACS technical documentation includes instructions and worked examples for approximating margins of error. The sources of uncertainty in ACS estimates are described in detail in the Understanding and Using ACS Data Handbook.
Our spatial geography project, IPUMS NHGIS, can also be used to download these published estimates with their corresponding margins of error.
2026-08-20 · General
I can answer your questions and hopefully clarify what is happeneing here.
- Why do some people in 1980 have an “N/A” value for RENT and a “Rented: With Cash Rent” value for OWNERSHPD?
The universe tab for RENT states that in 1980 households with data for this variable include:
Renter-occupied or vacant-to-rent units, not one-family houses on 10+ acres (3+ cuerdas in Puerto Rico); not group quarters.
Single-family houses on 10+ acres that are rented with cash rent are these cases that you are seeing. The variable ACREHOUS, which is only available for single-family homes, can be used to identify such households on 10+ acres. Once these households are excluded, there will not be any observations with both OWNERSHPD = 22 (“Rented: With Cash Rent”) and RENT = 0.
- Why are there some people with a “Rented: No Cash Rent” value for OWNERSHPD in 1980 have an “N/A” value for RENT?
This also relates to single-family households on 10+ acres, but those who rent with no cash rent. This discrepancy is also addressed by restricting the analysis to households with ACREHOUS < 2. Once these households are excluded, there will not be any observations with both OWNERSHPD = 21 (“Rented: No Cash Rent”) and RENT = 0.
- Does a RENT value of “no cash rent” in 1980 and 1990 mean something different from a “Rented: No Cash Rent” for OWNERSHPD in subsequent years?
Outside of the universe differences, these two groups are conceptually equivalent. One place that can be a helpful reference is the original questionnaire text, which you can find by adding samples to your data cart and navigating to the questionnaire tab for RENT and OWNERSHP.
Regarding the universes, there are two main differences that can be identified from comparing the universe tabs:
(1) Single family homes on 10+ acres are excluded from the RENT = 1 (no cash rent) group in 1980, but are always included in OWNERSHPD = 21 (“Rented: No Cash Rent”).
(2) Vacant-to-rent units without cash rent are identified with RENT = 1 (no cash rent) in 1980 and 1990, but vacant-to-rent units have OWNERSHPD = 00 from 1970-onwards..
2026-08-14 · CPS
The IPUMS Working Paper, Extending Current Population Survey Linkages: Obstacles and Solutions for Linking Monthly Data from 1976 to 1988, Version 2, describes in detail the challenges that IPUMS researchers have encountered in processing and linking these early CPS samples. The working paper notes that supplement-containing files in this period often contain partially or fully duplicated records. Additionally, there are a number of records in this period where the original household ID values (HHID) will not match the IPUMS CPS unharmonized variable UH_HHID_B1.
Specifically, UH_HHID_B1 has been edited for supplement-containing files in 1977. This is a result of a change to the method for generating household identifiers in the CPS in months that had a topical supplement that makes it impossible to link records between supplement-containing and basic monthly-only files in 1977. For these months, IPUMS CPS offers data from the supplement file rather than the BMS (though BMS variables contained on the supplement record are available). This affects six months in 1977: January, May, June, August, October, and December. Since IPUMS CPS offers both the March BMS and ASEC supplements as separate files, this does not affect the March BMS data. In each of these months, there are more supplement records than BMS records. However, due to changes in how linking keys were constructed we are unable to identify which records do not overlap between the two versions of the files.
Given this information, you might try adopting the following approach. First, drop any duplicate records where the values completely match. Second, merge only records in sample months that do not include a topical supplement. This merge should be possible using UH_HHID_B1 and the person line number UH_LINENO_B1. Finally, merge records in sample months that include a topical supplement. This merge should exclude the household and line number identifiers and instead focus on other available variables such as demographics and employment information.
2026-08-04 · USA
Thank you for bringing this to our attention. After reviewing the data, it appears that values of zero for CBPOVERTY are currently grouping two types of respondents: (a) those who are outside of the poverty universe and (b) those who are in the poverty universe and have family incomes of $0. I have shared this finding with my colleagues who will work on revising our processing of CBPOVERTY so that these two groups are separately identified. This affects the 2023 and 2024 ACS samples, but does not appear to be an issue in previous years.
It is possible to separately identify the 0 and not-in-universe groups using the source variable for CBPOVERTY, POVPIP. Source variables provided the original unharmonized variables that are the inputs for IPUMS harmonzied variables. Since source variables are specific to each sample, you will want to add the source variable that corresponds to your sample of interest (i.e., US2024A_POVPIP for 2024 and US2023A_POVPIP for 2023) to your data cart. Observations that are not in the poverty universe will have POVPIP = “BBB” while those in the universe with $0 income with have POVPIP = 0.
It is also possible to separately identify these two groups using the variables that describe the poverty universe. After restricting to CBPOVERTY = 0, there are three sub-groups that comprise individuals who are not in the poverty universe:
1. Persons with GQ = 3 (those in institutional group quarters).
2. Persons with GQ = 4 who are currently enrolled in school (SCHOOL = 2); these are students residing in campus dorms. Note that this means that remaining group quarters persons are included in the poverty universe.
3. Persons in households (GQ = 1, 2, or 5) who are not related to the householder (RELATE = 11-13) and are under the age of 15 (AGE 0-14).
2026-07-20 · USA · marked as solution
Thank you for bringing this discrepancy in the documentation to our attention.
After review, it appears that the -9999 bottom code for INCINVEST and INCBUS00 (INTP and SEM in the PUMS) was used in ACS samples from 2000-2008. Starting with the 2009 ACS, the bottom codes for these variables are instead set by state to the mean of all cases less than or equal to a state-level threshold value. As you note, these threshold values as well as the bottom codes for each sample are available on the ACS top and bottom codes by state documentation page. I shared your note with my colleagues who will update the documentation in a future release.
2026-07-13 · General
All available Male Anthropometry variables can be found using the variable selection drop-down menus under Topics → Biometrics → Male Anthropometry.
2026-07-10 · General · marked as solution
Adult male anthropometric variables are available on the Household Members unit of analysis. These include HWMHEIGHT (“Height in centimeters”), HWMWEIGHT (“Weight in kilograms”), and HWMWTHTPCTRMDHS (“Weight for height percent of reference median”) among others. IPUMS DHS has harmonized these variables for a limited number of samples; for sub-Saharan Africa these samples include:
Ethiopia (2011, 2016)
Ghana (2014)
Lesotho (2009, 2014)
Libreria (2013)
Namibia (2013)
Rwanda (2010, 2014)
Sao Tome (2008)
Senegal (2010)
Sierra Leone (2013, 2019)
South Africa (2016)
Uganda (2006, 2011, 2016)
Zimbabwe (2010, 2015)
Adult male anthropometric variables are available in other DHS samples but have not yet been harmonized by IPUMS DHS. I shared your interest in these variables with my colleagues on the IPUMS DHS team to see if these variables might be added to additional samples in the future.
If you require data for samples that are not on this list, you can download the data directly from the DHS Program website (from the individual recode file) and merge it with an IPUMS DHS data extract (see the Linking IPUMS-DHS Data to DHS Files user guide for step-by-step instructions).
2026-07-10 · USA
Thanks for letting us know about this issue. IPUMS USA prepared a new version of the 1860 Enslaved Population Data in June 2026, but it is not currently accessible on the website. I’ve alerted my colleagues who will address the issue. In the meantime, please email the user support team at ipums@umn.edu and we will share the file with you directly.
2026-06-18 · CPS
Thanks for bringing this discrepancy to our attention. Your observations are correct.
In the 2011 ASEC sample, cases with YRIMMIG = 39 (“2008-2010”) should be assigned to YRIMMIG = 40 (“2008-2011”). In the 2012 ASEC, cases with YRIMMIG = 43 (“2010-2013”) should be assigned to YRIMMIG = 42 (“2010-2012”). This pattern can be confirmed in the CPS ASEC codebooks for those years.
I will share your findings with colleagues who will implement this fix to the data.
2026-06-10 · Global Health
Hi Paul,
The child unit of analysis (KR) contains an observation for each child born within the preceding five years while the births unit of analysis (BR) includes an observation for each birth regardless of the time period. The observations in the KR can be thought of as a subsample of those in the BR since each child in the KR will have their birth as a record in the BR data. Additionally, both the KR and BR identify children who have since passed away in the variable KIDALIVE.
These adverse birth/pregnancy outcome variables you mention are typically only asked about recent births, which is why they are available in the KR but not the BR. It is possible to link across these units of analysis to add KR variables to an extract with BR data. To do this, you will want to identify each mother using IDHSPID and each of her children with BIDX (birth history index number) as linking keys.
2026-06-09 · International
The harmonized migration variable MIG1_7_PT and its corresponding source variable PT1981A_RESP73A report the subregion of residence in 1973. Subregions were not reported for persons who lived outside of Portugal and as a result persons who lived abroad are all assigned to this “Foreign Country” code.
However, the source variable PT1981A_RESP73B provides additional detail about the country of residence in 1973. While Angola, Mozambique, and several other countries are grouped into a single code to protect respondent privacy (see screenshot below), I hope that this additional detail is still helpful.
This source variable does not have a corresponding harmonized variable, which can make it more difficult to locate on the website. My recommendation on finding these source variables is, after selecting your samples of interest, to fill the Source Variables bubble from the variable selection page (see screenshot below). You will then be able to use the drop-down menus to navigate to groups of source variables, including PT1981A_RESP73B under the Person → Migration: Global menu, to see all source variables regardless of whether they have a corresponding harmonized variable.
2026-05-22 · CPS
It appears that the Public Use File begins reporting the ASEC Income Supplement interview status code starting in 1991. The 1989-1991 ASEC technical documentation specifically notes that this variable (FL-665) is only available in 1991. I was unable to find a comparable variable in the 1988 documentation; you can find the codebooks on the IPUMS CPS documentation page.
You might take a look at the data quality flag variables as an alternative approach. These are typically linked in the variables FLAGS tab (see screenshot below for example). While pre-1991 samples include imputation flags for some individual ASEC income variables (e.g., QINCWAGE), these do not appear to identify whether full record imputation occurred.
2026-05-19 · USA
These changes to the weighting procedure for the ACS are also discussed in this Census Bureau working paper. Generally speaking, the ACS samples from 2000-2004 are considered a testing period with nationwide implementation of the ACS only occurring in 2005. Moreover, nationwide implementation revealed additional data inconsistencies that had to be addressed. The ACS underwent numerous methodological changes during this period that affect comparability; chapters four and five of this detailed history of the ACS cover some of these.
IPUMS does not have any guidance for bridging this change in the methodology. My recommendation is to review the relevant Census Bureau user notes and working papers for information on how earlier estimates changed when the 2006 methodology was applied. This should help give a sense of whether the changes are significant enough to warrant dropping the 2002-2005 samples from your analysis or if you prefer to retain them given this methodological break.
You could also use the Current Population Survey (CPS) as a benchmark for these years. While the CPS is produced primarily for analyses of the labor market, it includes demographic variables as well and is weighted to be representative the civilian non-institutionalized population (refer to CPS Technical Paper 77 for details on the weighting methodology). IPUMS provides access to harmonized CPS data through IPUMS CPS.
2026-05-12 · CPS
UH_SUPREC_A1 and UH_SUPREC_A2 are examples of IPUMS unharmonized variables; these variables come directly from the source data in the CPS Public Use File (PUF). IPUMS CPS uses the source data to create harmonized variables that are consistent across samples. Using these two unharmonized variables as a case study, the *A1 variable uses different codes than the *A2 variable. The harmonization process takes these equivalent variables across samples and creates a single new variable by matching corresponding codes together. However in this case, no harmonized variable has been created that integrates the two ASEC interview status codes.
The IPUMS CPS website is designed primarily for researchers to obtain harmonized variables. The unharmonized variables are provided for reference as well as for cases such as this where a corresponding harmonized variable has not been created.
There are three main ways to search for unharmonized variables:
-
From the variable section menu, select the “Unharmonized Variables” bubble. You can then use the drop-down menus as you would for finding harmonized variables.
-
From the variable search menu, make sure to check the “Include Unharmonized Variables” box.
-
If an unharmonized variable has a harmonized counterpart, you can find it in that variable’s documentation (see the Unharmonized Variables tab for MISH below as an example).
2026-05-07 · International · marked as solution
The 1980 Argentina sample includes 672,062 households across 66,972 unique strata. It appears that the svydesign() function in R cannot handle this many strata at the same time. I was able to include STRATA in Stata’s svy command without any issues, so this appears to be an issue specific to R’s survey design packages. I’ve shared this issue with my colleagues on the IPUMS International team who will review whether STRATA can be constructed to be more user friendly.
While IPUMS International recommends using STRATA to produce more precise standard error estimates, for the great majority of studies there is little risk of drawing invalid inferences because of underestimated variance. Since the Argentina 1980 sample is systematic, STRATA captures implicit geographic stratification rather than an explicit feature of the sample design. You could therefore substitute a less granular geographic identifier such as GEO2_AR1980, which identifies 346 departments, in place of STRATA . Alternatively, you could drop stratification from the survey design entirely. Your standard errors will be slightly larger without these survey design parameters. This will matter more for studies of weak relationships or small population subgroups, but should not be too significant for studying large groups.
Additionally, note that for household-level analyses using HHWT, you will want to first filter your dataset to persons with PERNUM =1 so that each household is only counted once.
2026-05-05 · General
Data for UNION can be downloaded in a customized microdata extract for both ASEC (1990 - present) and BMS (May 1983 - present) samples. However, it is only available for the BMS samples in the online analysis system. The fact that the system gives a “cannot find specified variable” error for the ASEC analysis is expected, but it should not give you this error for BMS samples.
I was able to successfully tabulate UNION for BMS samples online (see screenshot below) without this error. Let me know if you are still getting an error with UNION in the BMS samples and if you’re adding any additional parameters and I’ll be happy to help troubleshoot the issue.
2026-05-01 · USA
The county election precinct that a respondent was enumerated in is identified in the IPUMS USA historical representative samples in the variable MCD (Minor Civil Division). Specifically, MCD is reported in samples from 1850-1930 that range in density from 1% to 10% of the total population (1% - 5% in 1900-1930). These samples were systematically drawn from the full data and should give you a reasonable estimate of the true values from the full count.
The IPUMS USA public use full count microdata does not report the MCD, however it is available in the restricted use full count data. The data requires an institutional license and includes a license fee; please email us at ipums@umn.edu if you would like to apply for a license and I will share the application materials.
If you prefer to continue using the public full count data, then you may be able to leverage the reported enumeration district (ENUMDIST) of residence that is available for all records from 1880-1950. These districts were created for each decennial census often by drawing from existing election precinct boundaries. In some cases, a district maps one-to-one onto a precinct. Other times a district may include multiple precincts in full or parts of several different precincts. Depending on how neatly these map in your counties of interest, you might try reconstructing precinct boundaries from these enumeration district identifiers. In my experience, the Unified Census ED Finder tool on Stevemorse.com can be very helpful for this type of analysis. This scanned document describing 1930 & 1940 enumeration district boundaries should be particularly helpful since it notes the correspondence between the districts and precincts. The Unified Census ED Finder tool might also help you find the descriptions for earlier years as well.
2026-04-20 · Time Use
Our contacts at CTUR appreciate bringing this issue to their attention and are carrying out a thorough check of the syntax and source files. I will provide an update here once I have information and if any revisions will be implemented. Thank you for your patience and understanding.
2026-04-13 · Time Use
You’re correct that ATUS participants who responded “Other” when asked how often they “provided any care or assistance for an adult who needed help because of a condition related to aging” were then asked to provide additional details in ELFREQ_SP (as noted in the questionnaire). However, the Census Bureau does not release data for this variable in the public use ATUS files that IPUMS harmonizes. I was also unable to find any aggregated data on what these “other” frequencies report.
You might be able to get more details on people who responded “other” by exploring their relationship to the care recipient (HH_EC and RELATER) and how long they have been caring for them (ECMONTH and ECYEAR). I wish that I could have been more helpful. Hopefully investigating this data further and consulting the literature for how other researchers have addressed this issue will help you determine how to best approach this missing information.
2026-04-10 · USA
This occurs when the default built-in Windows or Mac decompression tool is unable to correctly decompress the .gz data extract file. We recommend using 7-zip for Windows and The Unarchiver for Mac instead to correctly decompress IPUMS data extracts. This is a different issue than what Jose is describing.
2026-04-09 · Time Use
Thank you for bringing this to our attention. I can confirm that while the documentation provides codes for education-related activities such as MAIN = 15 (“Regular schooling, education”) and MAIN = 16 (“Homework”), the data file itself does not include any activity records with these codes. I am reaching out to my colleagues as well as to our CTUR contacts to determine how these activities were coded and will follow-up with further details.
2026-04-02 · General
Thanks for your careful consideration of our terms of use.
Regardless of whether a dissertation is published or not, we ask that it be added to the IPUMS bibliography if it uses IPUMS data and documentation. The bibliography’s broad coverage helps us better showcase the different ways the data is being used.
2026-03-31 · USA
The datasets on IPUMS USA do not include any information on student loans. However, the IPUMS Higher Ed data project harmonizes data from the National Survey of College Graduates which includes variables related to student loans such as UGLOAN (total borrowing for undergraduate loans) and UGBAL (remaining balance from undergraduate loans). You can find additional documentation and data from more recent years of this survey on the National Center for Science and Engineering Statistics (NCSES) website.
2026-03-27 · General
While FEMOWNHOUSE corresponds to v745a and FEMOWNLAND corresponds to v745b for the vast majority of samples, Malawi 2010 and Tanzania 2004 are one of the few where the DHS program uses a different mnemonic. In Malawi 2010, FEMOWNHOUSE is s826a and FEMOWNLAND is s826b. In Tanzania 2004, FEMOWNHOUSE is w122b and FEMOWNLAND is w122a. The original mnemonic applies for all of the other Malawi and Tanzania samples.
2026-03-27 · USA
Thank you for bringing this discrepancy to our attention. After reviewing the data, I can confirm that enumeration district 75000282 in 1910 includes all households in districts 282-294. Our historical data team will work to update the data on the website to provide the correct enumeration district for these households. In the meantime, I have sent you a crosswalk that assigns households to their correct district. Other users who would like access to this crosswalk should email the user support team at ipums@umn.edu.
Please let us know if you encounter any other issues or discrepancies in the data!
2026-03-26 · USA
Here are the links to compendiums:
1820 Volume
1840 Volume
The 1820 volume includes population data for the town of Dayton, Ohio on page 133 of the PDF. Data for Dayton in the 1840 volume begins on page 13 and continues through page 16 of the PDF. You do not need access to IPUMS NHGIS for these files.
IPUMS NHGIS is a website that is free for researchers where you can request and download standard data files in .csv format. These can be opened in applications such as Excel. If you plan to use IPUMS NHGIS to get county-level population data, you can register to access the data here.
2026-03-25 · CPS
The comparability tab for VETSTAT details how veteran status was determined across CPS samples. In particular, it states that:
In August 2005 and later samples, respondents are asked whether they ever served on active duty in the U.S. Armed Forces.
From my understanding, reserve and national guard members are not active duty unless they have been mobilized or deployed for service. Someone who was or currently is in the reserve or national guard but has never been put on active duty should have a response of VETSTAT = 1 (“No service”). However, the data from the CPS is self-reported and people may respond to questions in ways that don’t strictly follow these definitions. Note too that those currently on active duty are not included in the CPS data.
You might try using the CPS Veterans Supplement (administered annually in August) to identify reserve or national guard members. The supplement includes the variable VGUARDCUR that identifies those who are currently a member of the reserve or national guard; refer to the full list of veteran supplement variables. A major caveat for this approach is that the supplement only samples those who responded that they had previously been on active duty in VETSTAT. Someone who has never been on active duty would have VGUARDCUR = 99 (“Not in universe”) even if they are currently a member of the reserve or national guard.
2026-03-25 · NHGIS
Your question is in the IPUMS NHGIS topic, but I’m not aware of any data tables on IPUMS NHGIS that identify interracial marriages. My recommendation is to use the individual-level full count census microdata (offered from 1850-1950) on IPUMS USA. While there is no variable that identifies interracial marriages, it is relatively straightforward to construct such a variable using the available data.
The IPUMS USA microdata links spouses in the pointer variable SPLOC using the IPUMS family interrelationship linking algorithm (refer to the SPLOC variable documentation for more information). While the relationship between the household head and each individual is directly reported from 1880-onwards, the algorithm provides additional links between household members who are not the household head. Note that the 1850-1870 samples have all relationships imputed since these did not record relationship to head of household or marital status (refer to IMPREL for more information). Additionally, there have been many changes to reporting of race across time, particularly when it comes to multiracial groups. I strongly recommend reviewing the Comparability tab for RACE for an overview of these changes and issues to be aware of. The instructions to census enumerators can also be a helpful resource for understanding how this information was reported.
Once you’ve added samples and relevant variables to your data cart, you can use the Attach Characteristics tool to add a new variable called “RACE_SP” that will report the race of each person’s linked spouse. You can access this tool from the Extract Request window after clicking to view your cart and create your data extract. A simple tabulation of RACE by RACE_SP should then help you identify interracial marriages. We offer short video tutorials including on how to use the Attach Characteristics tool that may be helpful if you get stuck.
2026-03-25 · USA
My apologies for the delayed response to your post.
I checked your account last week and it appeared that all of your extracts had finished processing. Processing time can vary significantly based on the file size and the number of requests submitted by other users at the time. If you find that your extracts are taking significantly longer to process than expected, please email us directly at ipums@umn.edu with details and we will be happy to take a closer look.
2026-03-13 · CPS · marked as solution
The IPUMS CPS team has not processed these supplement samples as a result of prioritizing more recent samples; they are not aware of any inherent issues with the data.
Birthplace (BPL) is available in all CPS samples from 1994-onwards, but it does not provide additional detail beyond the country of birth. I am not aware of any CPS supplements that report the state of birth; this detail is however available in the ACS and Decennial Census samples on IPUMS USA.
Linking across CPS samples is constrained based on the CPS rotating panel structure (refer to the RoPES tool for a visual display of the panel). Households enter the CPS and are surveyed monthly for four months. Afterwards, they take an eight month break and then finish their time in the CPS with an additional four monthly surveys. As a result, it is possible to link persons across a maximum of eight appearances in the CPS; IPUMS CPS has created the unique person-level identifier CPSIDP and the validated identifier CPSIDV for this purpose. However, linking across supplement panels will likely not provide much additional details about respondents’ parents demographic characteristics. There are two main reasons for this: (a) the respondent must reside together with their parent in order for the parent to be identified and their characteristics linked to their child, and (b) the CPS surveys people residing in a selected housing unit and does not follow respondents when they move out of that unit. Linking across supplement panels will only yield additional details about the respondent’s parent if the parent does not reside with the respondent during the Voter supplement but does during one of the other seven samples that the respondent is surveyed in.
When a parent and their child do reside in the same household, they will be identified using IPUMS family interrelationship variables. POPLOC reports the person number (PERNUM) of the respondent’s coresident father and MOMLOC reports the PERNUM value of the respondent’s coresident mother. Researchers can use the attach characteristics tool to leverage these links and add new variables to the child’s record that report their parents’ values for selected variables. For example, if you have EDUC in your data cart, you can request that your extract includes each respondent’s coresident father’s EDUC value as a new variable called EDUC_pop. FBPL and MBPL (father’s and mother’s place of birth) are the only variables that I am aware of that directly report a demographic characteristic of respondents’ parents regardless of whether they reside together.
2026-03-13 · CPS
As mentioned in this forum post, the IPUMS CPS 2001 ASEC sample includes cases from the S/CHIP oversample, which are not included in the original 2001 ASEC data file on the Census Bureau’s website. You can access both files as well as the original codebook through this NBER data page. This IPUMS working paper (Rodgers, 2025) provides additional details about the oversample, which added approximately 20,000 households to the ASEC.
Regarding the 1988 rewrite of the CPS processing system, I can confirm the IPUMS CPS 1988 ASEC sample uses the redesign file that was created by applying the new processing system. The NBER data page includes a note explaining that the sample sizes of the two files are different due to differing eligibility requirements. It also includes documentation and data files for both versions.
Moving to the pre-1976 samples, I’m not sure exactly what would cause a discrepancy for these samples. One possibility is that for samples prior to 1980, the age cutoff for being in-universe for OFFPOV is 14 years (anyone below the age of 14 and not in FTYPE = 5 “secondary individual” is not-in-universe for OFFPOV). In 1980, this age cutoff increases to 15 years. If you could share more about your analysis and the mismatches you’re seeing, I can share more information on what may be happening.
2026-03-13 · General
Before I answer your questions, I should preface that the ACS reports industry using two different coding systems. Census industry codes are provided in the variable IND, while NAICS codes are reported in INDNAICS. While the granularity of the NAICS codes is very useful for categorizing industries, their specificity poses a confidentiality risk in public microdata published by the Census Bureau. As a result, NAICS codes are aggregated before being reported in INDNAICS. The industry codes in IND meanwhile are created specifically to allow for reporting of industry at an approved granularity.
To answer your first question, codes listed with fewer than all six digits are meant to include all NAICS codes that share the same digits. In your example, code 442 (“Furniture and home furnishings stores”) in the 2018 NAICS system includes all codes that begin with the digits “442”. However, as you noted, the exception to this are codes in the crosswalk that include a letter. Code 113M (“Forestry, except logging”) includes 2018 codes 113110 (“Timber Tract Operations”) and 113210 (“Forest Nurseries and Gathering of Forest Products”), but as noted in the label it does not include 113310 (“Logging”). Without the “M”, we would expect code 113 to include all three of these industries. While the P, S, and Z are notes about how the NAICS code maps onto the Census IND code, they also affect how the code should be interpreted. In 333MS (“Machinery manufacturing, n.e.c. or not specified”), the “M” indicates that this code is composed of multiple, but not all, industries that start with “333”. The “S” additionally indicates this industry category was created to correspond to an IND census code and has no direct equivalent in the NAICS. This Census Bureau crosswalk between IND and NAICS codes might help better visualize what these labels are communicating.
As you can see, this can get very complicated before beginning the work of crosswalking codes across different vintages. You might therefore look into using our harmonized industry variable IND1990. This variable maps Census IND codes from all years since 1950 into the 1990 Census Bureau industrial classification scheme, offering a consistent long-term classification of industries. You can read more about how crosswalks were used to construct this variable in our user note on integrated occupation and industry codes.
2026-03-06 · CPS
It sounds like you are encountering two issues. First, that your estimates of the number of direct care workers using CPS is not sufficiently close to the OEWS estimates. Second, that you are having a hard time capturing direct care occupations in your tabulations of the 2020-forward data.
It is important to note that the CPS and OEWS are quite different. CPS is a household survey that is representative of the US non-institutionalized civilian population. OEWS surveys establishments to produce employment and wage estimates for a subset of occupations. The surveys also use different coding schemes for reporting occupations. The OEWS uses the Standard Occupation Classification (SOC) to report occupations. The CPS reports occupations using the Census Occupation codes, which are based on the SOC, but are a separate coding scheme; this is true for both main job (IPUMS CPS variable OCC ) and second job (IPUMS CPS variable UH_OCC2JB_B2). Both coding schemes are updated periodically (approximately every 10 years) to accurately reflect the labor market. This change is presumably causing the issue you describe where you cannot identify direct care workers in certain years of data.
As a result of these periodic updates, the specific codes associated with a given occupation change over time. For example, the 2002 classification scheme that you link to only applies to a subset of CPS samples (2003-2010) and it should not be used for samples outside of these years. Even if the same codes appear in the data, they may refer to a different occupation in the new vintage. You should instead use the 2010 classification scheme for samples from 2011-2019 and the 2018 classification scheme for samples from 2020-onwards. To assist in using occupation across time, IPUMS CPS uses Census Bureau crosswalks to recode occupations from each vintage into a single harmonized occupation system in the variable OCC2010. Since the basis of this system are 2010 Census occupations, this variable recodes occupations from all of the vintages to the 2010 system (see below for a brief example of tracing an occupation across time in these crosswalks). While data for OCC2010 recodes the occupation for the main job, you can use it to find which codes from each vintage map onto each other for your analysis for second reported jobs. This IPUMS blog post details how you can create this type of crosswalk.
Below is a screenshot from the crosswalk for the 2010 to 2018 census codes. It shows that the 2018 code for “Home health aides” (3601) is one of three new occupation codes that were created by splitting the 2010 code for “Nursing, Psychiatric, and Home Health Aides” (3600) into three codes (3601: Home Health Aids, 3603: Nursing Assistants, and 3605: Orderlies and Psychiatric Aides). The crosswalk also shows the SOC codes that are associated with the Census Occupation codes. Note that two additional SOC codes are displayed under the new 2018 OCC code 3605 to indicate this singular Census Occupation code is comprised of two distinct SOC codes.
A code of 3600 (for OCC or UH_OCC2JB_B2) in the 2011-2019 data (which uses the 2010-vintage codes) can be used to identify “nursing, Psychiatric, and Home Health Aides”; it is not, however, possible to differentiate among the three groups in the 2010-vintage (unlike the 2018-vintage where they are assigned their own categories). The IPUMS CPS variable OCC2010 would assign a record with OCC = 3601 in 2022 to OCC2010 = 3600. Note that it is also possible for a Census occupation code to change while keeping the same occupation title (look into Personal Care Aides between the 2010 and 2018 coding schemes for an example), or for the code to remain the same but be assigned a new occupation title.
2026-03-03 · CPS
I am not an expert on this, but from my knowledge of the CPS sampling methodology nothing specific comes to my mind that would cause Davern et al.'s approach to estimating standard errors using a survey design-based estimator (with a stratum and clustering variable) to not work for non-ASEC samples. With that said, my recommendation is to consult with colleagues or review the literature for guidance on where this approach has been tried. Something to consider is that monthly samples are generally smaller than the ASEC and are therefore likely to have greater variance with both the internal and the public use data.
Should you choose to proceed with this approach, note that selecting a coarser final stratum, such as the state, does work around changing codes for metro areas but will likely tradeoff for less accurate standard errors. IPUMS CPS just recently released the variable PLACEFIPS, which provides consistent coding of central and principal cities from September 1995-onwards. Additionally, PLACECENSUS provides consistent coding for samples from October 1985 - May 1995 (metropolitan areas are not identified in June - August 1995). Bridging only two or three different coding systems might hopefully be much easier than the larger number of vintages in METFIPS.
Please be aware that SERIAL is only unique within a sample month. A combination of YEAR, MONTH, and SERIAL provides a unique identifier for every household in IPUMS CPS. The exception to this are households in the March BMS samples, which also appear in the ASEC samples.
2026-03-02 · Health Surveys
The MEPS collects information about panel participants’ medical events by directly interviewing medical providers. Data for each medical event, including the type of event and its related expenses, is recorded on its own event-level record. All of these records are associated with a panel participant. The variable EVENTYPE categorizes seven separate types of medical events, including ED/ER visits (EVENTYPE = 3) and hospital inpatient stays (EVENTYPE = 4), and can be used to identify the events you are interested in analyzing. An ED/ER visit that develops into an inpatient hospital stay is identified as two separate events, one for the ED/ER event and one for the stay. Since expenditures are reported for each individual event, you can obtain expenses for ED/ER events separately (see EVEXPSRCFAC for payments billed to facilities and EVEXPSRCDR for payments billed to doctors). You can also determine which inpatient stays are linked to an ER/ED visit using the variable EMERROOM.
All of these variables that I mentioned are on the event-level record, meaning that you will need to request a hierarchical data extract in order to add them to your data cart (see our note on extract data structures). The option to switch data structures is available on the right side of the variable selection menu. In a hierarchical extract, event records are nested underneath person records. Event-level variables, such as EVENTYPE, will appear on the associated event record. The person record will report any person-level variables that you add to your data extract such as AGE, which you can then use to differentiate between adult and pediatric medical events.
2026-02-24 · CPS
Thank you for sharing this code! As my colleague Isabel said in the other thread, we will review and modify the code as necessary. I’m sure that this will be helpful for users who can adapt the code for any other age threshold that is relevant in their work.
One aspect to be aware of in this approach is that some households with same-sex couples have two mothers identified for the same child; IPUMS USA offers the variable MOMLOC2 for identifying the second coresident mother.
2026-02-19 · General
IPUMS NHGIS provides digitized summary data tables from the 1980 decennial census, including the data on children ever born by state. You will need to use the Data Finder tool to filter for the correct table. In the screenshot below, I’ve filtered Years to 1980 and Topics to Births and Fertility. Table NTPA21 reports the number of women ages 15-44 by each number of children ever born (eight total groups ranging from none to seven or more). After adding the table to your data cart (click the green plus next to it), you can navigate to your data cart (hit continue on the upper-right) to select the geographic level that you want the data summarized to. In addition to summarizing counts by state, you can also choose to summarize data by county, county subdivision, place, standard metropolitan statistical area, and urban area. IPUMS NHGIS offers a user guide with short video tutorials as well as more in-depth resources to help you get started.
2026-02-19 · General
I was able to load your extract into R and did not observe this issue. I recommend reviewing this ipumsr vignette, which walks through the steps of loading an IPUMS fixed-width extract into R. You will need to download two files from the My Data page: (1) your .dat.gz compressed data file and (2) the corresponding .xml DDI codebook. The data file should be saved in the same folder as the .xml codebook. You should then set this folder as your working directory in R, load the ipumsr package, and run the accompanying R code provided on the My Data page (under command files):
ddi ← read_ipums_ddi(“meps_00001.xml”)
data ← read_ipums_micro(ddi)
This will apply the correct codes to your data.
2026-02-16 · General
From 1997-2018, the NHIS collected general information from a core questionnaire that gathered information about all household members as well as a more detailed questionnaire administered to one randomly selected sample adult and one sample child from each family. The variables that you’re using are from questions that were only administered to these sample adults. Adult family members who were not selected to complete the supplement survey will have a weight of zero for SAMPWEIGHT. This is described in our User Note on Sample Design and documented in the universe tab for each variable.
The language can be somewhat confusing and is not always self-explanatory; we offer a user guide to help familiarize researchers with the data.
2026-02-16 · General
Thanks for clarifying that this was from your extract #15. This extract was processed on 2/18/25. However, coding for METRO was recently revised on 1/28/26.
All major data updates and revisions are published on the IPUMS USA revision history page. The following note is included with this update:
For METRO, the code for ‘Metropolitan status indeterminable (mixed)’ changed from 0 to 2 and the code for ‘In central/principal city’ was changed from 2 to 5.
Extracts that were processed prior to 1/28/26 therefore use this earlier 0-4 coding scheme where:
0: Metropolitan status indeterminable (mixed)
1: Not in metropolitan area
2: In central/principal city
3: Not in central/principal city
4: Central/principal city status indeterminable (mixed)
You can continue using data from your extract #15 following this coding pattern, or resubmit this extract for processing to obtain the data using the updated coding pattern. I hope that clarifies what is happening in the data.
Thanks for also sharing your concern with us; it’s helpful as we think about how to better communicate these types of changes to data users.
2026-02-12 · General
I reviewed your most recent extract (#16), but did not observe this issue. That suggests to me that either the data was not decompressed and/or not correctly loaded into your stats package. I can run through the steps that I took to load the data and maybe this will help you troubleshoot what is happening.
First, I downloaded and decompressed the .dat.gz fixed width file. The Windows 11 decompression tool can have issues decompressing .gz files. Therefore, I used 7-Zip which is our recommended decompression software for Windows (see the Unarchiver for Mac). Since I am a Stata user, I then went ahead and downloaded the Stata .do command file and put it into the same folder as the decompressed .dat file. The process is the same for SAS and SPSS, except you will want to download the corresponding command file. For opening the data in R, you will want to consult this ipumsr vignette. I then ran the Stata. do file. The .do file (as well as the SAS, SPSS, and DDI files) includes the following labels for METRO:
label define metro_lbl 1 `"Not in metropolitan area"'
label define metro_lbl 2 `"Metropolitan status indeterminable (mixed)"', add
label define metro_lbl 3 `"In metropolitan area: Not in central/principal city"', add
label define metro_lbl 4 `"In metropolitan area: Central/principal city status indeterminable (mixed)"', add
label define metro_lbl 5 `"In metropolitan area: In central/principal city"', add
In the screenshot below, I have tabulated METRO and observed that all five values (1-5) are available. Please let me know if anything is still unclear.
2026-02-12 · CPS
Hi Tomas, based on you reply I actually have additional information and suggestions to share that I think would be helpful.
Overall, it’s crucial to understand that each longitudinal weight corresponds to a specific type of link. These are categorized based on the number of links and the period of time over which the links occur. When an observation links to a different sample(s), only a specific type of longitudinal weight can be used to analyze these linked observations. Therefore, any type of longitudinal link that you use will necessarily only include a subset of your total observations.
The time period between observations affects the number of possible and actual links, which affects the longitudinal weights. To take a step back, I am going to describe the CPS rotation pattern, discuss how the rotation pattern impacts longitudinal weights, and share a few comments on the provided longitudinal weights. I am hopeful this will provide you with a frame of reference for identifying how to use or adapt the existing materials for your specific application.
CPS Rotation Pattern
Households in the CPS are interviewed using a 4-8-4 rotation pattern where they are in the panel for four months, take an eight month break, and are interviewed for a final four months before exiting the panel. Besides the 8-month break when persons are not interviewed, individuals may drop out of the panel at any time if they move out of the sampled housing unit or reappear in the panel if they rejoin the housing unit (the CPS samples dwelling/housing units, not people; it will not follow individuals if they move). As a result, a person record in any given month of the CPS microdata may be linked anywhere from zero to seven times across the 16-month period when their household is in the CPS. You can visualize the CPS rotation pattern and how many people will link between months using the IPUMS CPS RoPES tool.
Longitudinal Weights in IPUMS CPS
The IPUMS CPS longitudinal weight variables provide a weight for person records that actually link between the specified time periods based on the population counts of the people who were eligible to link in those time periods. The goal is for the weights to inflate the sample of observed linkages to be representative of the population that was eligible to be linked. For example, LNKFW1YWT is used for weighting analyses for individuals linked across two observations separated by exactly one year. An example of this would be linking between adjacent years of the ASEC (e.g., 2023 and 2024). There will not be a longitudinal weight for persons who are observed in the 2023 ASEC and eligible to be in the 2024 ASEC but who are not observed in the 2024 ASEC, though their information will be used to generate the longitudinal weights. Persons observed in both the 2023 and 2024 ASECs will have a longitudinal weight. Persons who are not eligible to link (e.g., those who participated in the 2022 ASEC and will rotate out of the panel before the 2024 ASEC) will not have a longitudinal weight nor will they be used in the construction of the weight. Another example is LNKFWMIS14WT, which is used for a sample where all people are linked across four observations (their first four months in the panel) that are each exactly one month apart. The same logic applies, but the linking requirements are more stringent as individuals must be observed in all four months; this means fewer cases will link.
It’s still not fully clear to me what linking approach you are using to construct your panel, so I will explain two of our most widely used longitudinal weights:
My previous recommendation was to use two adjacent ASEC samples (excluding BMS) to generate LNKFW1YWT since only the ASEC samples have annual income data. This restricts your analysis to observations that are linked once exactly one year apart in the ASEC, retaining two out of the eight maximum number of appearances of each person in the panel (and only if they appear in the ASEC). You could also use LNKFW1YWT for weighting BMS samples that are one year apart (e.g., January 2023 and January 2024). It is not possible to use LNKFW1YWT for weighting linked samples that are not exactly one year apart.
Another approach that may be less restrictive for your analysis would be to use the BMS longitudinal weight for two adjacent months (LNKFW1MWT). This weight is provided anytime a person is linked between two adjacent months, which allows you to retain more of their individual observations across the panel than LNKFW1YWT. This BMS longitudinal weight can also be used for March BMS (ASEC non-oversample respondents), but it cannot be generated for ASEC oversample respondents since they will never appear in an adjacent month.
I encourage you to consult this PowerPoint on weights in CPS to help clarify which approach will work best for you.
2026-02-10 · USA
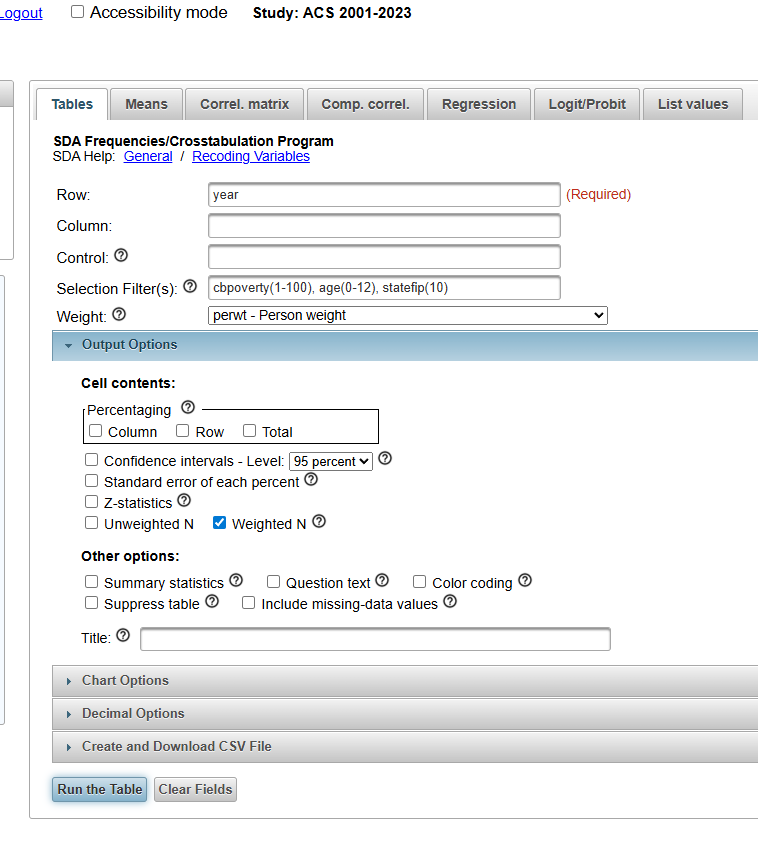
Each 1-year American Community Survey (ACS) sample is designed to provide estimates for a single year. For example, the 2024 ACS is collected during the 2024 calendar year and is designed to provide estimates for 2024. The ACS 2001-2024 option combines all of the years from this range into a single sample, meaning that analyses using this option provide a single estimate for the entire 24 year period (unless the variable YEAR is used). For example, if a group has a population size of 100,000 in 2001, and this number stays constant through 2024, then the estimate for the population size using the ACS 2001-2024 option would be 2.4 million (100k * 24). Note that pooling multiple 1-year samples is only an issue for estimates of frequencies or counts but not for other estimates like means or ratios. There are a number of different approaches that you could use to adjust these estimates:
-
You can obtain an average estimate for the 2001-2024 period by dividing the estimate by the number of samples. In the above example, this would mean dividing 2.4 million by 24 (since this period includes 24 total years of data) to obtain an estimate of 100k. This will give you the average population size of the group across all 24 years.
-
You can obtain estimates for each individual year or for a smaller group of years by adding “year” into the Selection Filter(s) field. For example, you can add year(2011-2024) to obtain estimates for this 14 year period. You will still need to divide weighted N’s by the total number of sample years.
-
You can use the 5-year ACS sample, which is designed to produce estimates that are representative over the five-year period. For example, the ACS 2019-2023 5-year sample will produce estimates for the 2019-2023 period as a whole. These do not need to be divided by the number of years since this is a single sample.
For each of these approaches, you should be aware that year of immigration (YRIMMIG) will be correlated with the years that you include in your analysis. For example, for an estimate the number of people who immigrated to the U.S. in 2015 using data from 2001-2024, most of the ACS samples will have zero people meeting those criteria. Getting an average over a period that includes samples from years prior to the YRIMMIG codes that you are interested in may not be very helpful.
Finally, please note that the ACS is a survey that is self-administered by 1% of US households each year. Estimates from the ACS will not perfectly replicate estimates from other sources or data from administrative records.
2026-02-09 · CPS
You might try running the code to create weights with one linked sample at a time in order to limit the computational load. To start, you can restrict your data file to just the 2002 and 2003 ASEC and run the code to create longitudinal weights for this linked sample. Save this file. Then, open a new file with only the 2003 and 2004 ASEC and run the code again. Repeat this until you have created longitudinal weights for your entire panel and then append all of the files together.
If you’re unable to create your own longitudinal weight, then my recommendation is to use one of the pre-constructed longitudinal weights such as LNKFW1YWT and work with the sample that has values for LNKFW1YWT. This means that you will need to drop all ASEC oversample observations since they will have missing values for this weight. Note that you cannot use this weight to link between samples that are not exactly one year apart or for weighting Earner Study variables. For additional insight, you might consider searching the IPUMS bibliography for other papers that make similar links to see what other researchers have done.
2026-02-05 · Health Surveys · marked as solution
Thank you for bringing this issue to our attention. After discussing with my colleagues on the data team, it appears that this recent change to recommended weights occurred inadvertently when food security module weights were added on 1/26/26 (see the revision history note). The website has been updated to again display the correct weights that should be used (e.g., PERWEIGHT for CANCEREV for 2008-2023).
2026-02-04 · CPS
Rather than prioritizing different weights based on availability, our IPUMS data team recommends using a single longitudinal weight. You might use one of the longitudinal weights that are offered or create your own by modifying the sample code. I’ll explain what different weights are used for so that you can determine the best approach for your study.
EARNWT, ASECWT, and WTFINL are all offered in order to make a cross-sectional sample representative of the US (civilian non-institutional) population. The correct weight for a cross-sectional analysis depends on the variables that you include, though only a single weight should be used at a time. For instance, EARNWT is used for analyses that include Earner Study variables, which are administered to respondents in one of the outgoing rotation groups. EARNWT adjusts for the fact that analyses of these variables are conditioned on respondents being in one of the outgoing rotation groups. Note that EARNWT is not used for analyses of income variables in ASEC samples since those are administered to all ASEC participants. If your analysis does not include any of the Earner Study variables and instead uses income data from the ASEC, ASECWT will be the correct cross-sectional weight.
These cross-sectional weights however are insufficient for longitudinal analyses since a linked sample by definition only includes people who can be linked between samples. There are many reasons why someone might not be linked between samples including cases where they stop responding to the survey or move out of the sampled household. Someone who is not linked would be dropped from your sample, biasing it in a way that cross-sectional weights do not address. A longitudinal weight however corrects for this by ensuring that the sample that is linked is representative of your population of interest. IPUMS offers a number of different longitudinal weights. LNKFW1YWT will likely be of particular interest since it is used for weighting linked persons across one year (such as between ASEC samples or between the outgoing rotation groups). Note that while PANLWT is another longitudinal weight, it is only used for weighting flows between employment status for adjacent months which does not appear to be the focus of your study.
One complication with LNKFW1YWT is that this weight is currently not offered for ASEC oversample respondents (ASECOVERP = 1). While the oversample makes up ~1/3 of the ASEC sample in each year, the oversample also adds a large number of Hispanic respondents to the ASEC. However, this can be used for weighting the remainder of linked ASEC respondents. Incorporating oversample respondents into LNKFW1YWT is possible, but requires recreating this weight by editing and running the Stata replication files that are offered in the linking the CPS user guide. The key edits include adapting the code to run for adjacent years instead of adjacent months and substituting mentions of WTFINL for ASECWT. A similar edit can be done to accommodate analyses of Earner Study variables by substituting WTFINL with EARNWT. This should be carefully considered since EARNWT is additionally constructed to reproduce labor force stocks (refer to CPS technical paper 66), which can affect estimates of transitions between employment status.
There is no need to divide the weights by r(mean). You may divide the final weights that you get by the number of samples in your extract; this is only necessary if you want to produce aggregate estimates (e.g., the number of naturalizations that occured), but is unnecessary for estimates that involve ratios (e.g., the percent of naturalized persons who saw an increase in their earnings).
2026-01-30 · General
IPUMS CPS has not integrated this variable into our system. We have been working to integrate additional supplement variables, so I will share your interest with the team.
If you require this data, you can download the unharmonized supplement from the NBER’s repository. You may then merge the sample with the rest of the harmonized data in an IPUMS CPS extract using the variables HRHHID, HRHHID2, and PULINENO (LINENO in IPUMS) as linking keys. If you email us directly at ipums@umn.edu, we may be able to share the source data from earlier iterations of the supplement.
2026-01-29 · USA
PUMS NHGIS has digitized tables with summary data from the 1960 census on the state and county level as well as for select census tracts; IPUMS USA provides a subsample of the person-level microdata files from which these tables are constructed. You can learn more about how to use the NHGIS Data Finder from the short video tutorials on our user guide as well as the FAQ page. If you share more about the specific table or topic of interest, I should be able to provide you with clearer guidance on how you might find this in NHGIS or how to tabulate the microdata subsample on IPUMS USA.
2026-01-28 · General
IPUMS does not define labor force participation or employment. Instead, our samples provide the data as it is reported in the original sample. I’m not sure which IPUMS data collection or samples you’re referring to, but I can provide details for our USA and CPS data samples.
The Current Population Survey (CPS) reports employment status (EMPSTAT) and labor force status (LABFORCE) following the definitions described on this Bureau of Labor Statistics Concepts and Definitions page. Note that this definition has changed over time, with the most recent major revision being in 1994 (see the IPUMS CPS EMPSTAT comparability tab for more information). The American Community Survey (ACS) implements this same definition in EMPSTAT & LABFORCE, with a small difference in that this survey contains fewer restrictions on what qualifies as a job search. The US decennial census samples include the most variability in these definitions; these are documented in the IPUMS USA EMPSTAT comparability tab .
The Bureau of Labor Statistics currently classifies people as employed if during the preceding week they they met any of the following criteria:
- They worked at least 1 hour as a paid employee (see wage and salary workers).
- They worked at least 1 hour in their own business, profession, trade, or farm (see self-employed).
- They were temporarily absent from their job, business, or farm, whether or not they were paid for the time off (see with a job, not at work).
- They worked without pay for a minimum of 15 hours in a business or farm owned by a member of their family (see unpaid family workers).
People are classified as unemployed if they met all of the following criteria:
- They were not employed during the survey reference week.
- They were available for work during the survey reference week, except for temporary illness.
- They made at least one specific, active effort to find a job during the 4-week period ending with the survey reference week (see active job search methods) OR they were temporarily laid off and expecting to be recalled to their job.
Those who do not meet either the criteria for being employed or unemployed are not in the labor force.
2026-01-26 · International
Thank you for sharing your interest in this data. IPUMS International has not yet begun work reformatting data or harmonizing variables from this sample. Therefore, we do not anticipate releasing the Canada 2021 census data this year. This will instead most likely be released in 2027.
2026-01-21 · IHGIS
Thank you for bringing this issue to our attention. I downloaded this IHGIS summary table and found that the column labels in the first row of the table are ordered incorrectly. Specifically, the column labels associated with 110 year-olds in the codebook (AAB1000-AAB1008) were incorrectly inserted between column labels AAB100 and AAB101 rather than at the end of the document (i.e., after column AAB999). However, the count values reported in the data (i.e., the second row of the table) were not altered.
This means that the population count listed in AAB100 is the total number of 10 year-olds (as documented in the codebook), but the next column has the incorrect label AAB1000 is listed with a cell that reports the number of 10-year-old males. Because of this error in labeling, the columns labeled AAB1000-AAB1008 are reporting counts for different groups of 10 year-olds and not 110 year-olds. All subsequent columns are also mis-labeled and off by one year (e.g., counts for 11 year-olds in row 2 are being labeled as 10 year-old counts). This error also explains the unexpectedly high number of of 110 year-olds. Here is the section that is causing this error with corrected labels:
AAB100: 10
AAB1000 10 : Males
AAB1001 10 : Females
AAB1002 10 : Urban
AAB1003 10 : Urban : Males
AAB1004 10 : Urban : Females
AAB1005 10 : Rural
AAB1006 10 : Rural : Males
AAB1007 10 : Rural : Females
AAB1008 11
AAB101: 11 : Males
While our data team is working on fixing this error, we would like to offer you an IPUMS mug as a token of our gratitude for helping us improve the data for all. Please reach out to us directly at ipums@umn.edu and let us know where we should ship your mug to!
2026-01-21 · General
Thank you for bringing this issue to our attention. I downloaded this IHGIS summary table and found that the column labels in the first row of the table are ordered incorrectly. Specifically, the column labels associated with 110 year-olds in the codebook (AAB1000-AAB1008) were incorrectly inserted between column labels AAB100 and AAB101 rather than at the end of the document (i.e., after column AAB999). However, the count values reported in the data (i.e., the second row of the table) were not altered.
This means that the population count listed in AAB100 is the total number of 10 year-olds (as documented in the codebook), but the next column has the incorrect label AAB1000 is listed with a cell that reports the number of 10-year-old males. Because of this error in labeling, the columns labeled AAB1000-AAB1008 are reporting counts for different groups of 10 year-olds and not 110 year-olds. All subsequent columns are also mis-labeled and off by one year (e.g., counts for 11 year-olds in row 2 are being labeled as 10 year-old counts). This error also explains the unexpectedly high number of of 110 year-olds. Here is the section that is causing this error with corrected labels:
AAB100: 10
AAB1000 10 : Males
AAB1001 10 : Females
AAB1002 10 : Urban
AAB1003 10 : Urban : Males
AAB1004 10 : Urban : Females
AAB1005 10 : Rural
AAB1006 10 : Rural : Males
AAB1007 10 : Rural : Females
AAB1008 11
AAB101: 11 : Males
While our data team is working on fixing this error, we would like to offer you an IPUMS mug as a token of our gratitude for helping us improve the data for all. Please reach out to us directly at ipums@umn.edu and let us know where we should ship your mug to!
2026-01-20 · General
GQTYPED will be automatically included in any extract that also contains the variable GQTYPE to your data cart. GQTYPE is one of several variables that include both a general code and a more detailed coded variable; the detailed variable is automatically added to data extracts that include the general code. You can see coding for GQTYPED by clicking on the “Detailed codes” option from the GQTYPE Codes tab.
While GQTYPED identifies many specific types of group quarters in the decennial census samples, the ACS PUMS (Public Use Microdata Sample) does not provide detailed group quarters type. As a result, GQTYPED will mostly report the same information as GQTYPE. Since institutional group quarters (GQTYPED = 100) are all grouped together, it’s not possible to distinguish between individuals in different institutional group quarters (e.g., those in nursing homes and those in prisons) in the ACS.
You should also note that from 2011-onwards, the ACS PUMS file adds synthetic records for persons in group quarters as part of Group Quarters Small Area Estimation (GQSAE). To learn more, consult the 2011 PUMS accuracy document which states that “the GQ population sample has been supplemented by a large-scale whole person imputation into not-in-sample GQ facilities.”
2026-01-16 · USA
Our exchange thus far has been through the IPUMS forum. You can email our user support team directly at ipums@umn.edu.
2026-01-14 · USA
It’s great to hear that there is a project encouraging wider use of the NPB scores! The researcher who wrote the code for these variables is no longer at IPUMS, but if you email us I can share more information such as our code for generating the variables and our internal process documentation.
We note in the description tab for NPBOSS90 that the “scores were based on the earnings and education levels of the employed civilian labor force aged 16 and above, excluding persons who did not work in the past one year.” This latter condition restricts the median calculation to the experienced labor force, which is identified with WORKEDYR (worked last year) = “yes” in all samples except in 1950 where WKSWORK1 (weeks worked last year) > 0 is used instead.
You are also correct that IPUMS considers all individuals in the experienced labor force rather than just household heads. It is also the case that medians are calculated by occupation without regard to the sex of individual workers. While only data on persons in the experienced civilian labor force is used to construct the scores, all persons with a recorded occupation are assigned their occupation’s score. In samples from 1960-onward, occupation information is available for many people who were not working at the time of the census. In 1960 and 1970, occupations were reported for persons who had worked within the previous ten years. From 1980-onward, occupations were reported for persons who had worked within the previous five years. In these cases, the occupation that the respondent worked in their most recent job was recorded. Researchers who wish to exclude currently unemployed persons from their analyses can use the LABFORCE variable to do so.
NPBOSS90 uses occupation groups in the IPUMS harmonized occupation variable OCC1990, while NPBOSS50 uses OCC1950. These harmonized occupation variables are created by IPUMS from the original occupation data to provide researchers with a consistent classification of occupations across time. Extensive documentation on how these variables were created is available in the variable description tabs as well as in the integrated occupation and industry codes user note.
2026-01-13 · CPS · marked as solution
FTOTVAL (total family income) reports the sum of INCTOT (total personal income) for all family members within a household; see FAMUNIT for information on how family membership is constructed. INCTOT itself is the sum of many individual components of individual income, including 21 components in ASEC samples from 2019-onwards. These are listed on the INCTOT comparability tab. Note that INCBUS (non-farm business income) and INCFARM (farm income) are the only components that are allowed to be negative to indicate losses. As a result, FTOTVAL will be negative when those losses are greater than all other sources of income across family members.
The decision of whether to adjust FTOTVAL for inflation or skewness will depend on your specific project. Our user support team is unable to provide this type of analytical advice. I recommend reviewing how this is addressed by other papers in the literature to help inform your approach to these questions. IPUMS CPS offers an Adjust Monetary Values feature from the Extract Options menu (immediately before submitting your extract for processing). Using this feature will adjust values for inflation by adding a new variable to your extract that reports values that have been converted to 2010 dollars.
2026-01-12 · USA
Due to the smaller sample size in subgroup analyses, the official poverty rate will typically have a larger margin of error than it does for the entire population. Similarly, estimates using the PUMS data may deviate more from published point estimates due to this greater sampling variability.
You should continue using person weights (i.e., PERWT) for analyzing specific groups if your outcome of interest is in terms of people (e.g., percent of widowed women aged 65 and older who are below the poverty threshold) rather than in terms of households (e.g., percent of households below the threshold).
If you do not require individual-level microdata, you might consider using data from IPUMS NHGIS for your analysis. IPUMS NHGIS offers geographically aggregated summary statistics from the full ACS data file released by the Census Bureau. We offer a User Guide on IPUMS NHGIS to help familiarize users with the data as well as a brief FAQ page.
2026-01-09 · General
IPUMS USA offers six samples from the 1970 Census, each containing records for 1% of the US population. The samples differ by the level of geographic detail identified (State, metro, and neighborhood) as well by questionnaire variant. While all Census respondents received the same short-form questionnaire, one-in-five households also responded to a long-form questionnaire with additional questions. There were two variants of the long-form questionnaire (i.e., Form 1 and Form 2). As a result, both Form 1 and Form 2 samples include data on the same set of core variables as well as a different set of additional variables for each form.
It is possible to pool together the three Form 1 1970 samples (or the three Form 2 samples) in order to create a 3% sample of the form one data since these samples are, for all practical purposes, mutually exclusive. This type of procedure is referenced on page 8 of the 1970 codebook. Additionally, since respondents received either the Form 1 or Form 2 questionnaire, samples across these different forms can also be pooled together. Please refer to this previous forum thread for more information as well as how to properly weight this type of pooled sample.
2026-01-09 · USA · marked as solution
Thank you for noting that STRATA is missing in the 2024 ACS sample. I will check with my colleagues to see if we will offer this in the future. In the meantime, you can use Public Use Microdata Areas (PUMAs) to identify strata in the 2024 sample (strata are identified as unique PUMAs in the 2005-onward ACS samples).
Please note that replicate weights are the recommended method to produce standard error estimates. We offer a detailed user guide with sample code for generating error estimates using replicate weights. You can find person-level replicate weights in the variable REPWTP. Replicate weights do not require a strata or PSU identifier.
2026-01-08 · USA
IPUMS USA provides documentation for composite measures of occupational standing variables in this user note as well as in the documentation for individual variables (e.g., NPBOSS50, NPBOSS90, SEI). Our user support team is happy to answer any questions that you have about these either on the forum or over email at ipums@umn.edu.
2026-01-07 · USA
The ACS Public Use Microdata Sample (PUMS) will not perfectly replicate poverty rates that are reported by the Census Bureau using the full data file. This is due to both confidentiality protections (e.g., rounding of earnings and suppression of details for group quarters types) as well as the fact that the PUMS microdata includes only about two-thirds of the records that are used to produce ACS estimates (refer to the PUMS User Guide for further information). With this caveat in mind, I can share a few suggestions for your approach.
First, the 12.5% estimate from the Poverty in States and Metropolitan Areas: 2023 report is the percent of people who are below the official poverty threshold. For person-level estimates, you should not filter by PERNUM. Restricting by PERNUM = 1 is only necessary for household-level estimates (i.e., the percent of households below the poverty threshold). You should also weight person-level estimates with PERWT. Second, I recommend using the variable OFFPOV to more accurately replicate published statistics (rather than HHINCOME). OFFPOV directly reports whether the respondent’s family income is below or above their poverty threshold, removing the need to calculate this yourself. This variable also does not need to be adjusted for inflation and correctly applies the group quarters universe for poverty estimates.
In the screenshot below, I tabulate OFFPOV in the 2023 ACS using the IPUMS USA online analysis tool. I apply the selection filter OFFPOV(0,1) to only keep cases that are in-universe. This results in an estimate of 12.2% of the population being below the official poverty threshold. Given the constraints in the PUMS file, this seems reasonably close to the 12.5% estimate in the report.
FTOTINC (total family income) will not replicate estimates reported by the Census Bureau. FTOTINC reports family income using a more inclusive family definition (see FAMUNIT) rather than the one used by the Census Bureau. In particular, FTOTINC sums incomes of unmarried cohabiting couples (and their relatives) whereas family incomes reported by the Census Bureau are only summed across members related by blood, marriage, or adoption. As a result, family incomes using FTOTINC will on average be slightly higher than official estimates.
2025 · 177 replies
2025-12-31 · USA · marked as solution
Due to the sampling method and respondent error, it is expected that estimates using the ACS will not be identical across sample years. Data from the ACS is used to produce estimates, but it cannot provide the true value. Random sampling may result in more households residing in older buildings being included in the survey in one year compared to another. Respondents may also differ in their knowledge of when their home was constructed. For example, tenants may be more likely to make a mistake in reporting the decade that the home they rent was constructed in when compared to homeowners. Changes in renting patterns in this case will affect estimates even when the housing units being sampled remain constant.
I also was able to replicate your previous estimates of the number of households residing in housing units constructed before 1940 (169,256 households in 2023 and 179,201 in 2024). I was able to replicate these estimates by including vacant units in my sample. These are housing units that do not have any usual residents (see VACANCY for more information). These units do not have any person records attached to them and are excluded from the online analysis tool.
2025-12-24 · USA
The American Community Survey (ACS) samples about 1% of US households in each survey year by sending selected households a self-administered questionnaire. Though estimates should closely match across survey years, these data are subject to some variability based on household sampling and response rates as well as reporting error. This is partially addressed by using the household sampling weight HHWT, which adjusts the ACS sample to be representative of the US population.
I was unable to replicate your estimates using the IPUMS USA online analysis tool. To run this analysis, I selected the American Community Survey, 2001-2024 sample. In the tables function (see screenshot below), I input BUILTYR2 into the Row field, year into the Columns field, and YEAR(2023, 2024), STATEFIP(47), GQ(1,2,5), PERNUM(1) into the Selection Filters(s) field. This produces a tabulation of BUILTYR2 by YEAR for 2023 and 2024; STATEFIP restricts the analysis to Tennessee, GQ retains only households, and PERNUM ensures that each household is only counted once. I also selected the household weight HHWT. The resulting table showed an estimate of 144,455 pre-1940 housing units in the 2023 sample and 148,375 such units in the 2024 sample. You can also request confidence intervals for the estimates in the online tool (find this under the Output Options menu). The 95% confidence intervals for the two estimates show significant overlap, suggesting that any difference is due to random sampling error.
Going back to your first post, there is indeed an error in BUILTYR2 code 27. In both the 2023 and 2024 ACS samples, BUILTYR2 = 27 (“2022”) combines units built in 2022 with those built in 2023. I will alert my colleagues of this error so that a separate code for units built in 2023 can be created. Meanwhile, you may use the source variables US2024A_YRBLT and US2023A_YRBLT to differentiate units between these two construction years. BUILTYR2 = 28 (“2024”) correctly identifies units constructed in 2024.
2025-12-24 · USA
The IPUMS USA team just released the 2024 ACS data on 12/18/25. ACS data releases are always included in the online analysis tool, so the data will be available for your students to use!
2025-12-22 · CPS
IPUMS CPS has not yet integrated the July 2024 Disability Supplement into our system. For earlier iterations of the supplement, IPUMS CPS harmonized the Census Bureau’s supplement person weight PWSUPWGT into the variable DISUPPWT. This weight takes into account the fact that the disability supplement is only fielded to CPS respondents age 15+. Therefore, at most the weight will sum to the size of the US non-institutionalized population age 15+. Since IPUMS CPS has not yet released this sample, I’m unable to confirm whether this is the case with the newest sample. If you can share some more information about your issue (e.g., what variables you are tabulating, what your counts are), I can try to share some more thoughts on what may be happening.
2025-12-18 · General
Combining ACS and ATUS metropolitan identifiers into a single analysis presents some comparability issues. As I explain below, my advice is to use IPUMS NHGIS to obtain metropolitan statistics from the ACS summary files (rather than from the IPUMS USA microdata). You can then link statistics to either the IPUMS ATUS variables METFIPS or METAREA depending on the areas that you want to analyze, with two important caveats: (a) estimates from smaller areas and especially those with with a total population of less than 500,000 should be treated with caution, and (b) changes to metropolitan delineations in the ACS summary data as well as in the ATUS will affect the comparability of your estimates across these vintages and across surveys.
While both the metropolitan statistical area (MSA) and the combined statistical area (CSA) of residence is directly reported for respondents in the IPUMS ATUS variables METFIPS and METAREA respectively, this is not the case for respondents in the ACS microdata. In these samples, only the state and the Public Use Microdata Area (PUMA) are provided. IPUMS geographers assign metropolitan identifiers in variables such as MET2013 and METAREA by overlaying PUMA boundaries with metropolitan boundaries and applying a population-based identification protocol. As a result, not all metropolitan areas can be uniquely or consistently identified in ACS microdata (see the MET2013 description tab for our protocol). If your goal is to use the ACS to produce metropolitan-level summary measures, then a better alternative is to use IPUMS NHGIS. This project integrates the Census Bureau’s 1-year and 5-year ACS summary files, tabulating variables for many different geographic levels. Note that NHGIS summary tables use metropolitan delineations that are contemporaneous with the survey year. This differs from MET2013, which applies consistent 2013 Office of Management and Budget (OMD) delineation across samples (see the 2013 CBSA delineation file on our geographic resources page).
Moving to your ATUS analysis, the decision of whether to use METFIPS or METAREA will depend on the number of areas that you would like to identify and the minimum precision that you set for your estimates. The MSAs reported in METFIPS are more detailed than the CSAs in METAREA since CSAs consist of combinations of metropolitan and/or micropolitan areas. This allows you to identify more areas, but with overall less precision due to smaller sample sizes. The Census Bureau provides the following cautionary note (applicable to the ATUS as a subsample of Current Population Survey respondents):
One set of estimates that can be produced from CPS microdata files should be treated with caution. These are estimates for individual metropolitan areas. Although estimates for the larger areas such as New York, Los Angeles, and so forth, should be fairly accurate and valid for a multitude of uses, estimates for the smaller metropolitan areas (those with populations under 500,000) should be used with caution because of the relatively large sampling variability associated with these estimates.
In addition, it is important to consider the issue of changing MSA and CSA boundaries both across years and the timing of these changes across the two surveys. The US Office of Management and Budget (OMB) updates MSA & CSA boundaries about once a decade. These revisions create new areas, demote others, and determine which counties are associated with an MSA/CSA (refer to the historical delineation files). The ATUS applies one set of boundaries from May 2004 through April 2014 (2003 delineations), and another beginning May 2014 (the same 2013 OMB delineations as in MET2013). Meanwhile, the ACS uses 2003 delineations in 2003-2012, 2013 delineations in 2013-2022, and 2023 delineations in 2023-onward samples. This not only affects comparability of estimates across vintages, but also requires matching vintages correctly between the ACS and ATUS (e.g., 2013 ACS data uses the 2013 delineations while the 2013 ATUS uses 2003 delineations).
2025-12-16 · USA
Thanks for your question. To look into this issue, I compared results from the Census Bureau’s Public Use Microdata Sample (PUMS) with the harmonized IPUMS USA version of these data. I did not see any differences between these two data sources. I describe my process for each below. I hope this is helpful in troubleshooting your analysis!
Here are the criteria I used for the IPUMS USA Online Analysis Tool. I chose to analyze the 2023 1-year ACS sample.
ROW: YRIMMIG
SELECTION FILTER(S): BPL(2000)
For estimates of the number of people in the US for each year of immigration, you will want to select “perwt”. For the unweighted sample size, you will want to select “None” for the weight. My unweighted case counts for persons in the 2023 1-year ACS who were born in Mexico (BPL = 200) are 2,241 who entered the US in 2022 and 1,509 who entered in 2023. When selecting “perwt”, the corresponding population estimates are 290,486 in 2022 and 179,684 in 2023, respectively.
To analyze the Census Bureau’s PUMS file, I used the MDAT tool. After selecting the 2023 ACS-1 Year Estimates PUMS, I added the variables POBP and YOEP. The first of these can go into the Columns field and the latter to Rows. I tabulated both unweighted counts and weighted estimates by selecting the corresponding option under Select Weight. The results were the same as those from the IPUMS USA analysis (see second screenshot below).
Though not directly related to your issue, you should be aware that ACS estimates of immigration in the survey year itself are systematically lower than the true number of arrivals. The continuous collection of data for the ACS throughout the year means that immigrants who arrive late in the year have a lower opportunity of being sampled. For example, while the 2023 ACS estimate of the number of immigrants from Mexico in 2022 was 290,486, this same estimate in the 2022 ACS was only 157,322.
IPUMS USA
Census Bureau MDAT
2025-12-16 · NHGIS
When joining the crosswalk table to the 1990 block group parts table, it is important to be aware that a single 1990 block group part can be associated with multiple 2010 block groups. One reason you could be seeing fewer 2010 block groups is because your join is only returning the first matching 2010 block group. To fix this, it’s necessary to run a one-to-many merge so that additional rows are added for 1990 block group parts that have multiple observations in the crosswalk.
If you get a data table for 1990 block group parts that’s limited to Ohio, then there will be a few cases of 1990 block groups parts from the Ohio crosswalk that do not match to any in the Ohio data table; these are BGPs from states neighboring Ohio. State-specific crosswalk files include all target zones for the state as well as any source zones that intersect any of those target zones, including some source zones from neighboring states in cases where the Census Bureau adjusted state boundary lines between censuses. In cases like this, to produce a complete set of data for a single state, it’s necessary to obtain source data for both the state of interest and its neighboring states to ensure you have the required input data to allocate to all target zones in the state. These areas can be identified by a GISJOIN code that does not begin with the state code for Ohio (39).
Additionally, there are cases of 1990 block groups parts from the data table that do not match to the crosswalk because they are entirely in coastal or Great Lakes waters; see the note on blank/missing identifiers for reference. These block group parts all have a zero in the arealand column in the data table, and they also have no population or housing units. The discrepancy in the number of 2010 block groups between the shapefile and the crosswalk is for a similar reason as well: NHGIS shapefiles erase all areas that are entirely in coastal or Great Lakes waters, but these areas are still present in the crosswalk.
2025-12-15 · CPS
Thanks for asking us about WTVET. After looking into this, my IPUMS CPS colleagues realized this was inadvertently removed when we overhauled supplement weight variables. We will restore the variable soon (perhaps with the release of the December BMS data). VTSUPPWT will also be retained.
The August 2025 Veterans Supplement Public Use File has not yet been released by the Census Bureau. Once the file is made available, the team will determine a timeline for releasing the harmonized data. Knowing that there are users looking to use the new supplement data is very helpful for this, so I will be sure to note your interest! For reference, the 2024 file was posted on 3/24/25 and the IPUMS CPS harmonized version was released on 8/8/25.
2025-12-03 · CPS
From my experience, a common mistake with using IPUMS income variables is forgetting to account for NIU (not in universe) specialty coding. Let me describe what these specialty codes are and how you can obtain your estimates with them in mind.
Weekly earnings are not ascertained for all persons in the CPS. For example, respondents are not asked to report weekly earnings for infants, toddlers, or young children. The criteria used to determine whether someone is eligible to have data for a variable is the variable’s universe. Not in universe specialty codes are assigned in cases when a respondent is outside of the variable’s universe. For example, infants are by default assigned the NIU code for weekly earnings. The codes tab in the documentation for EARNWEEK2 notes the following specific variable code:
999999.99 = N.I.U.
The universe for EARNWEEK2 is provided in the its universe tab:
1989+ (non-ASEC): Civilians 15+ currently employed as wage/salary workers and in 2 (out of 8) rotation groups. Excludes self-employed persons.
NIU observations are typically excluded in analyses. However, it is important to be aware of who is then excluded from your estimates. The median value of EARNWEEK2 with NIU observations excluded will report the median weekly earnings of non self-employed civilians 15+ currently employed as wage/salary workers.
IPUMS CPS offers an Online Analysis Tool that can help you run these types of tabulations. In the screenshot below, I have selected to analyze all BMS samples and chosen the Means program. I applied the selection filters year(2021, 2023), month(9), earnweek2(0-999999) in order to restrict the analysis to in-universe values of EARNWEEK2 for September 2021 and 2023. I entered EARNWEEK2 into the dependent field and YEAR into the row field. I also selected EARNWT as my sampling weight (since EARNWEEK2 is one of the earner study variables) and requested that the median be displayed in the Median/Percentile Options submenu. The results showed a median weekly income of $920 in 2021 and $1000 in 2023.
2025-12-03 · CPS
Thresholds for the Official Poverty Measure (OPM) are updated annually based on inflation reported in the CPI-U. When assigning poverty status in the ACS microdata (available via IPUMS USA in the variable CBPOVERTY), the Census Bureau uses the survey year’s thresholds. Similarly, the variable that reports OPM status based on IPUMS family identifiers (POVERTY) also applies the survey year’s inflation adjustment factor to the baseline threshold (see the user note on poverty definitions in IPUMS samples).
The Census Bureau does offer a within-year adjustment factor that you might consider (see our user note on income standardization). The purpose of this is to adjust dollar amounts to the amount that they would have been had they been earned entirely during the calendar year, allowing you to directly compare these amounts to the survey year’s poverty threshold. However, since the month of survey is not provided with the public microdata, only a single annual adjustment factor is available. Given that a constant adjustment factor cannot adjust dollar amounts to calendar-year dollars, we leave the decision of whether to use this factor to individual researchers.
2025-12-01 · General
I assume your estimates differ by this much because you are including persons who are employed but in the Armed Forces. EMPSTAT = 1 identifies active duty members of the U.S. Armed Forces. These persons are excluded from the civilian noninstitutional population age 16 and older, which is the base group used for employment statistics (refer to the Bureau of Labor Statistics definitions page). When running your analysis by filtering to just EMPSTAT = 10 or 12 and summing by COMPWT, your estimates will match these topline FRED series values. Below is a screenshot of monthly estimates for 2025 that I obtained using the IPUMS CPS Online Analysis Tool.
2025-12-01 · CPS
The IPUMS CPS team released the harmonized September 2025 CPS Basic Monthly Survey data this morning (see the revision history page). This followed the delayed release by the Census Bureau of the public use file on Friday, November 21st.
The Census Bureau has provided a revised schedule that notes, among other things, that household survey data were not collected for the October CPS and will not be collected retroactively. The Census Bureau also expects that extra processing time will be needed for the November CPS.
2025-11-26 · Health Surveys
I suspect that your confusion stems from the sampling procedure implemented with the 2019 redesign of the NHIS. The IPUMS NHIS website has a note that details all of the changes in depth. Regarding the sampling procedure, the redesign eliminated data collection on all household members. Moreover, it also substituted detailed data collection on a single adult and child per family to a single adult and child per household. A household includes all people residing together in a single housing unit, such as a house, apartment, or a series of rooms, without separate entrances to divided living quarters. A family however contains all persons related by blood, marriage, or adoption residing together in the same household.
There are a number of scenarios where a household will contain multiple families with unrelated children:
- A tenant and their family rents from another family that lives in the same housing unit.
- An unmarried cohabiting couple, each with a child from a different partner, all living together.
The successful merger of cases with ISPARENTSC = 3 suggests that these are households that have a sample adult and sample child, but that these two individuals are not in the same family. The non-mergers of ISPARENTSC = 3 and then cases where there is no sample child in the sample adult’s household.
2025-11-25 · General
I was unable to replicate your issue with summing US2023A_PINCP and did not observe any labels and values being inverted. I hope that explaining my process and sharing suggestions below will help you troubleshoot the issue. You may also find it useful to review our Data Training Exercises, which include sample problems and code that is intended to familiarize users with IPUMS data formats. We also offer short online tutorials that walk through the essentials of using IPUMS USA.
To replicate your issue, I first downloaded your extract #5 as well as the corresponding Stata .do file (right-click on STATA under the Command Files column for this extract and select “Save link as…” to save the .do file). It is necessary to download the .do file to load a fixed-width (.dat) data extract into Stata. Note that you may also request your extract to be formatted as a Stata .dta file (rather than a fixed-width file) that can be opened directly into Stata without requiring a .do file. This option is available from the Extract Request page (under Data Format) immediately before you submit your extract for processing.
Your extract #5 contains the 2023 American Community Survey (ACS) individual-level microdata where each observation is a person enumerated in this ACS sample. Each observation includes data for some variables that are automatically added to your extract and others that you have individually selected. This includes the variable US2023A_PINCP, which is the source variable released by the Census Bureau that reports total personal income in the 2023 ACS.
IPUMS USA offers the harmonized variable INCTOT, which integrates all of the sample-specific source variables reporting total personal income into a single variable. If you were to have multiple ACS samples in your extract (e.g., the 2022 and 2023 ACS), adding the variable INCTOT is essentially adding both US2023A_PINCP and US2022A_PINCP; the first is used for INCTOT for 2023 survey participants and the latter for 2022 participants. Additionally, INCTOT applies consistent coding across the integrated source variables. For example, 9999999 is always used to code N/A cases rather than using changing mnemonics such as BBBBBBB (this is noted in the codes tab for INCTOT). While the source variables are helpful for tracking down changes in reporting by the Census Bureau, we recommend that researchers use the harmonized variables for data analyses.
After executing the .do file to load the data into Stata, I destringed the variable US2023A_PINCP with the code:
destring(us2023a_pincp), generate(us2023a_newp) force
I then summed the new variable across household SERIAL by running:
bysort serial: egen hh_income = sum( us2023a_newp)
The incomes appear to have been correctly summed. In the screenshot below, the household with SERIAL 357812 shows that the personal income values 21,000 and 45,000 summed to 66,000.

ADJINC is an adjustment factor offered by the Census Bureau as an optional method for adjusting income values to be more comparable. In 2023, the adjustment factor was 1.019518. Our user note on standardization of income variables discusses how to apply this factor, as well as the potential benefits and downsides of this method.
2025-11-24 · CPS
I suspect that the source of your discrepancy is in the inclusion of persons who are not in the universe for UNION.
The variable UNION assigns all persons in the data to one of four codes:
- 0: “NIU” (Not in Universe)
- 1: “No union coverage”
- 2: “Member of labor union”
- 3: Covered by union but not a member"
The Universe tab for UNION states that the universe for UNION is:
Civilians 15+ currently employed as wage/salary workers and in 2 (out of 8) rotation groups. Excludes self-employed persons.
All persons who do not fit into this universe definition are assigned UNION = 0. When including all four of these codes, I am able to replicate your 8.7% union coverage estimate. However, since all four codes are included, this estimate reports the percentage of all persons who are a member of a union rather than the percentage of all workers. You note that you exclude self-employed and unemployed workers, but your estimate appears to still include many not in universe cases. An easier option is to exclude all cases of UNION = 0 from your analysis. When I do this using the IPUMS CPS Online Analysis Tool, the estimate that I get is that 15.9% of all persons in the universe for UNION are members of a labor union. In the screenshot of the online tool below, I selected to analyze all CPS BMS samples. I then included the filters “year(1990)” and UNION"(1-3)".
While some people who do not fit the universe (such as self-employed persons) might be members of a labor union, no data on these people’s union membership was collected. Note also that excluding everyone with UNION=0 is different from excluding self-employed and unemployed people because the universe of UNION is more restrictive than that since it also excludes non-civilians and those who do not work for a wage or salary.
2025-11-21 · General
IPUMS MEPS has started work on releasing family level weights, but they are not currently available online. I will share your interest with the IPUMS MEPS team as they review priorities for data releases in 2026.
In the meantime, you can obtain these weights from the 2023 full year consolidated data file on the MEPS AHRQ website and merge the data with an IPUMS MEPS harmonized data extract. Our user guide on merging these datasets notes that from 2018-onwards the IPUMS MEPS identifier MEPSID can be directly matched to DUPERSID in the AHRQ file for linking between person-level records.
2025-11-19 · General
The documentation for the chirps API R package notes that the get_chirts() function queries four different variables: Tmax, Tmin, RHum, and HeatIndex. Additionally, the get_esi() function allows users to obtain the evaporative stress index (ESI). The WBGT data from the CHIRPS-ERA5 appears to not be not available through this package.
I was however able to download the daily CHIRTS-ERA5 WBGT .tiff data from the page that you linked to. We have two blog posts on accessing data through the CHIRPS package: Flexible Workflows with CHIRTS Temperature Data and Attaching CHIRPS Precipitation Data to DHS Surveys
2025-11-19 · NHGIS
By summing atom counts, do you mean that you want to sum characteristics, such as population counts, across intersecting geographic units (e.g., intersections of block groups and census tracts)?
If so, a quick method in Excel may be to create a pivot table from the joined tables. The pivot table option is available in the far-left of the toolbar in Excel after selecting Insert. Using a crosswalk with intersections of block groups and census tracts that include with your characteristics of interest, you can customize your table by dragging the identifier for the larger area (e.g., census tract) to the rows field and the characteristic that you would like to summarize to the values field. This Microsoft support guide dives deeper into the different options available with creating pivot tables.
2025-11-07 · USA
As of Version 2.0, the Multigenerational Longitudinal Panel (MLP) now incorporates nicknames as part of the linking method.
2025-11-06 · USA
Am I correctly understanding that you are seeing cases in the 2023 1-year ACS sample with HHTYPE = 0, GQTYPE = 0, and GQ = 1?
I reviewed the data, but was unable to find these cases. There are instances where two of these three conditions match:
- HHTYPE = 0 & GQTYPE = 0 corresponds to vacant units (see VACANCY), but these household records all have GQ = 0 (“Vacant Unit”).
- GQTYPE = 0 & GQ = 1 includes households with up to four individuals unrelated to the household reference person (this is the maximum threshold for households in 1970). However, I was unable to find any records in this group with HHTYPE = 0.
It appears that you requested this extract using the API. If so, could share your extract definition so that I can take a closer look at these cases?
2025-11-03 · Health Surveys
I took a closer look at the data and was able to confirm your findings. Specifically, I am seeing 192 persons in the 2018 full year consolidated file who reported at least one month of concurrent enrollment in both a federal or state marketplace and in Medicaid/CHIP. The most common case is a single month of overlap (71 cases). This type of overlap is expected during transition between coverage types. This is because coverage is indicated as long as the respondent reported at least a single day of enrollment within the month. The remaining cases are more unclear; IPUMS does not have a recommended approach and leaves the decision on how to identify the primary source of coverage to individual researchers.
Broadly speaking, you may consider there being two possibilities that explain what is happening. The first is that this is the result of misreporting on the part of the interviewer or interviewee. This is possible since enrollment is self-reported by MEPS participants and is not verified against administrative records. The second possibility is that this indicates true dual enrollment. While federal rules state that persons who are eligible for health coverage through Medicaid or CHIP cannot get subsidized marketplace coverage, from my understanding it is possible to remain enrolled in a marketplace program without a subsidy. You may consider reaching out to an expert at the Agency for Healthcare Research and Quality (AHRQ) for further guidance.
2025-10-28 · Health Surveys
From my understanding, the National Family Health Survey (NFHS) data corresponds to the following DHS Program samples:
The smallest administrative unit that is identified in the NFHS/DHS varies and is either the region (NFHS-1, NFHS-2, NFHS-3) or the district (NFHS-4, NFHS-5). Additionally, the district is the lowest geographic level identified in the India Human Development Surveys (IHDS) as noted in the FAQ (see question four). Since both the NFHS-4 and IHDS-2 include district identifiers, it is possible to summarize data for each district within the datasets and then merge them together by matching district identifiers. Note that this does not link households or persons between the surveys.
IPUMS DHS provides the sample-specific district in the variable GEOALT_IA2015. Since the district identifiers in the IHDS use the Census 2001 district identification number, you will want to be aware of possible changes that occurred in district boundaries. You should also note that the DHS sample uses a different numbering system that assigns a unique number to each district that does not repeat across states. Using both the state identifier as well as the labels that provide the district name will be helpful in accurately merging district-level data between the two surveys.
2025-10-17 · USA
While our user support team does not provide code review, from experience I have found that a common mistake with income variables is forgetting to account for specialty coding. The codes tab in the documentation for HHINCOME notes the following specific variable code:
9999999 = N/A.
Not applicable specialty codes are assigned to persons who are not in the universe for their corresponding variable. The definition of who is in the universe for a particular variable is provided in that variable’s universe tab; in the case of HHINCOME, persons in group quarters (GQ = 3 or 4) as well as vacant units (GQ = 0) are outside the universe definition (since there is no household to calculate household income for) and are therefore assigned this specialty code. Note that the majority of variables include this type of specialty coding. These codes are retained in the data to allow researchers to independently determine how to incorporate these cases into their analysis. You might consider dropping cases with HHINCOME = 9999999 before running your analysis, with the caveat that your estimates will exclude persons living in group quarters.
2025-10-14 · International
My apologies for the technical difficulties. Our IT team was able to confirm that your extract was not correctly processed by our system. Since the issue has been resolved, please go ahead and request a new data extract.
Since you requested a Stata formatted (.dta) data extract, your extract will by design not include a (.do) command file. Once you’ve downloaded and unzipped your (.dta.gz) data file (we recommend 7-Zip for Windows and The Unarchiver for Mac), you will be able to open the resulting file directly in Stata without requiring a command file. Command files are only produced when requesting a fixed-width (.dat) data file, since they are required for inputting this unformatted data into a statistics package.
2025-10-13 · CPS · marked as solution
ASEC oversample respondents are currently linked to one another across ASEC samples, but are not linked to their BMS records. Any potential linking of ASEC oversample respondents to their BMS records is significantly complicated by the fact that they are not administered the March BMS. As stated in the Including the ASEC Oversamples in Linked CPS Data working paper, the ASEC questionnaire is administered to three groups:
- All respondents to the March CPS Basic Monthly Survey
- An oversample of Hispanic households (1976-present)
- An oversample of non-Hispanic households with a child under 18 or a non-white household member (2001-present)
Neither the second nor third group are administered the March BMS and therefore, by design, do not have a March BMS record to link to.
While all oversample records have a CPSIDV value (the validated version of CPSIDP) assigned by IPUMS, this does not mean that they have been linked to the BMS samples. These linking variables are created as a result of the linking algorithm implemented by researchers at IPUMS; they are not provided by the Census Bureau and are only created once a link has been established by the algorithm. Since the algorithm does not currently link persons in the oversamples to any of their BMS responses, the result is that these persons are assigned one CPSIDV/P value when they are part of the ASEC oversample and a different one for when they are in the BMS samples.
2025-10-13 · USA
You are correct that IPUMS USA currently imposes a maximum value for COSTELEC of $9,990. This limit carries forward assumptions about the maximum possible value for this variable based on previous samples. However, the current maximum value unfortunately means that any annualized costs that exceed this threshold are truncated and reported as $9,990 in COSTELEC. Using the example you provided where the original top coded value for monthly costs is $3,100, when multiplied by 12 the annual value ($37,200) exceeds the currently allowed maximum value, and is instead reported as $9,990. My IPUMS USA colleagues are aware of the issue and are working to modify this maximum value to avoid censoring these types of high values.
In the meantime, you can obtain the original monthly electricity costs by adding source variables for COSTELEC to your data extract. These provide the reported values with the PUMS top codes, but before they are multiplied by 12 or cut-off at $9,990. Since each sample will have a different corresponding source variable, you will want to first add all of your samples of interest to your data cart. The source variables tab will then display the variable for each of your samples so that you can more easily add them to your data cart. Note that the source variables use the placeholder value “BBBB” to denote variable specific categories including cases that are not-in-universe.
More broadly, I want to make sure that you are aware that vacant rental units do not have data for rental or utility costs in the ACS. While you can request a household records only extract from the Extract Request page (right before submitting the extract for processing) that includes these types of vacant units, you will find that all households with VACANCY = 4 (“For seasonal, recreational or other occasional use”) are not-in-universe for these variables. You might take a look at the American Housing Survey for data on these types of vacant units.
2025-10-10 · International
Since applications to access IPUMS International data are reviewed by our staff to ensure the proposed research projects are appropriate as per agreements with the original data providers, account review and approval typically take about one week. However, my colleague who reviews applications to access IPUMS International data was able to provide expedited review in this case. I hope that you are able to get the data that you need for your project.
2025-10-08 · CPS · marked as solution
The CPS is not typically used to produce state-level estimates of poverty in part due to the relatively large variance for these types of estimates. The Census Bureau’s Poverty in the United States report includes the following note (on page 53):
The Census Bureau recommends that people use the CPS ASEC for timely and thorough estimates of national poverty. However, the Census Bureau produces other data that are appropriate for subnational areas and longitudinal analysis. The American Community Survey (ACS) and the Small Area Income and Poverty Estimates (SAIPE) program can be used for subnational poverty estimates, while the Survey of Income and Program Participation (SIPP) provides monthly and longitudinal estimates.
IPUMS USA provides data from the American Community Survey and the U.S. census through 2023. You can estimate poverty rates using these data with the variables CBPOVERTY and POVERTY, which differ substantially. CBPOVERTY is the Census Bureau’s original poverty status measure and is based on Census Bureau family unit definitions, while POVERTY is an IPUMS-created variable that relies on our own definitions of family units. You can read more about the differences in these variables by clicking the links to the variables. See also the Supplemental Poverty Measures available from IPUMS USA, such as SPMPOV, an alternative indicator of poverty status that incorporates the value of tax and transfer benefits not included in the official poverty measure. See this page for more information about measuring poverty in IPUMS USA data.
While studying poverty at the state-level with CPS data is not recommended, I was able to observe a similar decline by reproducing your analysis using ACS data from IPUMS USA. In the screenshot below, I use the IPUMS USA Online Analysis Tool to produce annual estimates of the number of children under 13 living in families at or below the federal poverty line using the Census Bureau’s family definition in CBPOVERTY. When I run this table, I find that the estimated number falls from 30k in 2010 to 22k in 2023. Additionally, the Poverty in the United States report linked above reports a similar national decline in the number of children under 18 living under the poverty threshold from 16.3 million in 2010 to 11 million in 2023 (see Table A-3 on page 22).
2025-10-06 · CPS
Our data are by default delivered as compressed *.gz files. After downloading your data extract, you will need to decompress or unzip it. We recommend 7zip as a free decompression software for Windows and The Unarchiver for Macs. Note that the built-in decompression tool in Windows 11 has occasional issues with these data files.
More broadly, you can request your extract to be delivered in one of five different types of compressed data files; these are fixed-width text files (.dat.gz), comma separated values (.csv.gz), and files formatted for certain statistical software packages including those for Stata (.dta.gz), SAS (.sas7bdat.gz), and SPSS (.sav.gz). Once you’ve determined which of these formats works best for you, you can modify your data request by selecting Data Format from the Extract Request page in your screenshot. R users will want to select fixed-width text files and follow the instructions in the getting started vignette on ipumsr.
You will need to use a statistical software package of some sort to analyze these data to convert them into meaningful statistics. I am linking to our data training exercises, which provide guided examples of working with the microdata files. If you do not have access to one of these statistical packages, then we recommend trying our Online Analysis Tool which can be used to run tabulations of counts and means, as well as some regression and comparison of correlations analyses.
2025-09-29 · CPS · marked as solution
As you note, there were a number of changes to the CPS Volunteer Supplement in 2017. These included new references to volunteering through an association, a change in universes (from those aged 15+ to 16+), as well as the replacement of some questions about volunteering with new broader questions about engagement with one’s community. A major change that is likely driving the decrease in the number of non-volunteers is the large increase in supplement non-interviews from 2015 to 2017:
-
In 2015, non-interviews occur if an eligible respondent provides a “refused” response to either of two questions: “Have you done any volunteer activities through or for an organization in the past year?” or “Sometimes people don’t think of activities they do infrequently or activities they do for children’s schools or youth organizations as volunteer activities. Have you done any of these types of volunteering activities in the past year?” 20,777 of the 104,534 eligible supplement respondents (~20%) refused one of these questions and classified as non-interviews based on this criteria.
-
In 2017, the definition of a non-interview was redefined to cases when an eligible respondent “refused” to answer the question, “How often did you talk to or spend time with friends and family?”. 37,888 of the 102,123 eligible supplement respondents (37%) refused this question and were assigned as non-interviews based on this criteria. The refusal rate has continued to hover around 40% in subsequent years.
While the volunteer supplement weight (VLSUPPWT) partially corrects for bias from undercoverage, biases may still be present when people who are missed by the survey differ from those interviewed in ways other than age, race, sex, Hispanic origin, and state of residence. It seems reasonable to me that willingness to respond to the interview may be correlated with having volunteered outside of these demographic factors. Abraham, Helms, and Presser (2009) argue that non-response was significantly biasing estimates from surveys in the period before this doubling in the refusal rate:
The authors argue that both the large variability in survey estimates of volunteering and the fact that survey estimates do not show the secular decline common to other social capital measures are caused by the greater propensity of those who do volunteer work to respond to surveys. Analyses of the American Time Use Survey (ATUS)— the sample for which is drawn from the Current Population Survey (CPS)—together with the CPS volunteering supplement show that CPS respondents who become ATUS respondents report much more volunteering in the CPS than those who become ATUS nonrespondents. This difference is replicated within subgroups. Consequently, conventional adjustments for nonresponse cannot correct the bias. Although nonresponse leads to estimates of volunteer activity that are too high, it generally does not affect inferences about the characteristics of volunteers.
I recommend consulting the current literature for methods that may help improve comparability between this break in the survey methodology.
2025-09-25 · General
As I understand, you are trying to use the IPUMS Multigenerational Longitudinal Panel (MLP) to link adults in one census to a previous census record when they resided with their parents in order to identify their co-resident siblings. This method seems reasonable, but requires careful consideration. In cases where all members of a group of siblings resided in their parental household in a single census year, the linking method will produce only a subsample of the siblings from the pooling method that I described in the post above. This is because the MLP is unable to link all persons across all of their census records (see the MLP data description for more information). However, for cases where some siblings are linked back to their parental household in one year while others are linked back to the household in a different year, the MLP can help identify additional groups of siblings that pooling alone cannot.
Note that HISTID does not uniquely identify people across the full count samples. It instead uniquely identifies each person record such that a person who appears across multiple full count samples will have a different HISTID value for each of their records. Aside from identifying each person record, HISTID values for each record remain consistent across releases of the IPUMS historical full count data, allowing researchers to track any edits to individual records across different release versions of the data. The HIK (Historical Identification Key) will be more helpful as it tracks individuals across full count samples by matching HISTID values of persons linked using the IPUMS Multigenerational Longitudinal Panel (MLP) algorithm. It is possible to use the attach characteristics option to add HIK_MOM/POP to your extract.
As I mentioned, there are two broad cases of sibling links to consider: (a) those where all siblings are linked back to their parental household in a single census year, and (b) those where some siblings are linked back to their parental household in one year while others are linked back to the household in a different year (or not at all):
- The first type can be identified using the pooling method described in the previous post. A linked census sample containing the same years as a pooled sample will identify a smaller number of the same siblings as the pooled sample. This is due to the fact that when requesting linked census data, users are provided with the option to either “include only those persons linked across censuses” or to “include all persons in the household of persons linked across censuses”. In both cases, if no one in a household is linked across the selected census samples they will be dropped from the extract. This filtering is not applied when requesting unlinked samples.
The MLP can still be helpful if you have a specific target year in which you want to identify siblings or if you want to track siblings over time. For example, if you are looking for all siblings in 1940, you can first identify all siblings who lived with their parents in that year using a single unlinked sample of the 1940 data. Then, you can use a linked census sample to add to those the siblings who can be linked from previous years. When you request a linked census sample (e.g., 1930 and 1940), the data will include two person records for each individual, one for 1930 and one for 1940. Each person’s HIK is automatically provided in the extract and can be used to group pairs of linked person records. By obtaining the linked individual’s 1930 household SERIAL number and MOMLOC/POPLOC values, you can then search for matching combinations of these values across your sample of linked 1940 individuals. This can also be done with a sample of multiple linked decennial censuses (e.g., 1920 and 1940 with 1930 and 1940), as long as all of the siblings in each group link back to their parental household in the same decennial census sample (whether 1920 or 1930 in this example).
- If some siblings link back to their parental household only in 1930 while others only link to 1920 (or do not link at all), then the MLP can help locate additional groups of siblings that pooling alone cannot by relying on parental links in HIK_MOM/POP. For example, suppose that you have siblings with a relatively large age gap where one of them is 8 years old in 1940 and the other is 18 years old. Additionally, the 18 year old is living elsewhere and not enumerated with their parents or siblings in 1940. In this case, the sibling pair will not be easily matched since the younger sibling will not be linked with the older sibling to the parental household in 1930. However, with an extract of multiple linked decennial censuses that has HIK_MOM/POP included, you can after grouping linked person records and obtaining any HIK_MOM/POP values, identify matching instances of these values across decennial census samples as siblings. Note that HIK_MOM/POP will only be available if the mother/father is in the household and the parent links to at least one other decennial sample (any of the 1850-1950 samples regardless of whether they are in your data cart) since those who do not link are not assigned a HIK value.
When using linked data to identify siblings, it will be important to differentiate between matches that are the same linked person from those who are their siblings (the individual HIK values should help). Finally, all linking methods are affected by the representativeness of who is linked by the MLP. See the MLP data description page section on representativeness for more details.
2025-09-19 · USA
Since our revision of OCC2010 includes several improvements that increase comparability over time, I’d first recommend taking a look at how the changes affect your results. For example, the reassignment of registered nurses reflects additional detail that we were able to provide in this update.
Note that the paper you referenced describes the OCC1990 variable, so I would not expect those crosswalks to help you recreate the previous version of OCC2010.
I am sharing two crosswalks for your reference if you choose to pursue reproducing the previous version of OCC2010. These crosswalks map the unharmonized (i.e., OCC codes) to the previous harmonization scheme for OCC2010. There are separate files for using the 2010-2017 ACS and 2018-forward ACS data; the former use the 2010 vintage of OCC codes; the latter uses the 2018 vintage. Note that in multi-year ACS files, OCC codes are based on the year that the file was publicly released. For example, in the 2015-2019 5-year ACS sample, the OCC codes for respondents in 2015 were crosswalked by the Census Bureau to the set of OCC codes used in 2019 to create a single vintage of the occupation variable.
July 2025 OCC2010 Crosswalk (2010-2017).csv (11.8 KB)
July 2025 OCC2010 Crosswalk (2018-).csv (6.4 KB)
2025-09-18 · CPS
The unharmonized source variables UH_MAJACTX_B1 and UH_MAJACT_B2 report the respondent’s main activity in the previous week in the BMS data from 1989-1993. UH_MAJACT_A3 is the corresponding variable in the ASEC. Since a respondent could have provided school as their main activity and still report being employed, I recommend using these in combination with EMPSTAT to identify those who reported being in school and were coded as not in the labor force.
Note that a survey redesign in 1994 included significant changes to procedure for determining labor force status. As described in the EMPSTAT comparability tab, the main activity ice-breaker question prior to 1994 was dependent on the subject’s age and sex. Due to evidence that this encouraged underreporting of part-time work by women, these procedures were edited so that the main activity would be similarly ascertained for all adults.
I will share a note with my colleagues to look into adding these unharmonized variables to EMPSTAT to help make these details more accessible in the future.
2025-09-12 · Health Surveys
It sounds like you are trying to merge data on the condition record (condition codes ICD10CODE/ICD9CODE) with demographic data on the person record. These two record types can be linked using the unique person-level identifier MEPSID and MEPSIDX, the same person-level identifier as reported on the condition record.
Note that it is possible to include both person-level and condition-level records in a single file from IPUMS MEPS by selecting a hierarchical file type and adding variables from these record types. For instance, if you request an extract with the variables AGE, SEX, and the above condition codes, your extract will include all of these in a single data file, where the condition record will be nested under the corresponding person record. In the screenshot below (copied from the extract structures note from our user guide), the hierarchical data file nests the condition records (RECTYPE = X), event records, and round records under the person record that they correspond to.
2025-09-10 · CPS · marked as solution
While there is a specific response option for reporting Pell Grants, unfortunately there is not a variable reporting this information included in the public use file.
The variable SRCEDUC combines information from three separate variables in the ASEC:
- UH_EDTYP1_A1 reports whether someone received government assistance for education (such as Pell Grants, but excluding loans and VA education benefits).
- UH_EDTYP2_A1 reports whether someone received assistance in the form of scholarships/grants from their school.
- UH_EDTYP3_A1 reports whether someone received assistance from any other source (except family members) to pay for their education.
These variables are also linked to in the unharmonized variables tab for SRCEDUC. The seven codes for SRCEDUC (excluding the NIU code) refer to all possible combinations of responses to these three questions. A combination of SRCEDUC codes 1, 4, 5, and 7 will identify all respondents who received any government assistance (excluding loans and VA education benefits) to pay for their education expenses. Note that government assistance is not restricted to assistance from the federal government and may also include assistance from state governments.
2025-09-09 · ipumsr
Thanks for your patience and for flagging this issue for us. We have resolved the technical issue on our side, and you should now be able to download your extract using ipumsr or ipumspy.
2025-09-05 · General
I will do my best to answer your questions based on my review of the documentation and general familiarity with the data. I have worked to flag where I was able to find explicit documentation on the subject as opposed to where I am making assumptions.
SCHLCOLL does not differentiate between those enrolled in college or university. Instead, students in these post-secondary education programs are coded based on whether they were enrolled full time or part time. SCHLCOLL = 3 identifies those who are enrolled in “college or university full time” while SCHOLCOLL = 4 identifies those who are enrolled in “college or university part time” (see the codes tab). While I wasn’t able to find any guidance that specifically references graduate school for this variable, I would assume that graduate school students are understood as being enrolled in a “college or university” and are then coded depending on whether they are full time or part time.
The CPS questionnaire asks respondents whether in the previous week they were “enrolled in a high school, college, or university”. Students who were enrolled, but on a holiday or seasonal break during the reference week (typically the week containing the 12th of the month) are still considered enrolled. As you note, summer break is the only exception where a student who reports being enrolled and not attending any classes would be coded as not being enrolled.
In general, the universe that IPUMS CPS reports for variables matches those provided by the Census Bureau, there are occasionally cases that do not align with the original, provided universe for the variable. We provide the original CPS codebooks for reference to users who want to examine such cases further and document large and systematic deviations from the provided universe if we become aware of such discrepancies.
The ACS and CPS differ in their methodologies, so I would not expect estimates from the two to line up perfectly. In addition to different reference periods, the surveys have different sampling strategies. The ACS is a questionnaire that respondents fill out on their own, while the CPS is typically administered through an in-person to phone interview. The continuous collection of ACS data as well as the three month reference period in GRADEATT may also significantly ameliorate challenges in interpreting the effects of summer breaks between academic years.
2025-09-03 · General
For the benefit of others reading the forum post, I am summarizing the guidance that Daniele helpfully linked above. As stated on the geographic tools page, IPUMS USA microdata can be joined to the IPUMS USA or IPUMS NHGIS GIS boundary files. The same steps provided at the bottom of the page for joining with NHGIS boundary files can also be used to construct GISJOIN codes for joining with the NHGIS summary data tables.
As you describe, while both IPUMS USA and IPUMS NHGIS release data derived from the ACS, the formats are different and there are different strengths and limitations of each. The microdata on IPUMS USA is best for running regression-style analyses with multiple variables, while IPUMS NHGIS is best for obtaining geographically precise aggregate estimates. There are certainly cases where using the two together can strengthen your analysis, but many users are able to get most or all of what they need from using just the microdata or just the summary files.
2025-09-02 · USA
Thank you for bringing our attention to this issue. You’re correct that here is an error in the data label. The correct value is provided in the data code and should be used without the accompanying label. In the example that you shared, 44 is the correct value and the 4.4 label should be disregarded.
While the original fixed-width .dat data files have one implied decimal place, in formatted data files (such as your Stata extract) this division is performed automatically. As a result, the provided data code is correct while the labels add an unnecessary additional decimal point in cases where the value is an integer. I’ve shared your findings with my colleagues on the data team who will investigate further and fix this discrepancy.
2025-08-26 · International
The IPUMS International team has reviewed the discrepancies that you reported and applied a consistent coding system that will be implemented in the next data release. The team also discovered that some observations with MIGCTRY0 = 15150 (“Cape Verde”) combined persons who reported migrating from Senegal together with those from Cape Verde. This only affects MIGCTRY0 for the Spain 2001 and 2011 samples (265 cases in 2001 and 902 cases in 2011 that responded “Senegal” but were incorrectly coded as “Cape Verde”).
Until the fix is released, you may use the source variable ES2011A_RES10CTRY in 2011 to distinguish between those who lived in Senegal and those who lived in Cape Verde ten years prior to the census. We can share with you an extract with the fixed MIGCTRY0 variable for Spain 2001 (and 2011), if you need to update your analysis before we complete our upcoming data release. In all other cases, the labels correctly define the reported code and there is no need to combine or separate any regions.
2025-08-21 · CPS · marked as solution
We recently re-released this sample (See the CPS Revisions History: August 8, 2025) in order to make variables from the Tobacco Use supplement available. No other changes were made to the core data, but because the sample was replaced, our system flags this to users. The data is still available, you will just need to remove the sample and then re-add it to that extract before submitting it.
2025-08-21 · CPS · marked as solution
VERIFY reports whether someone who previously replied “no” to having (in the previous calendar year) any of the types of health insurance asked about in their CPS interview says that they indeed had health insurance coverage. The majority of people are not in the universe (NIU) for VERIFY since they will have reported having had some type of health insurance coverage in the previous calendar year. These NIU persons are assigned a code of 0, having already confirmed health insurance coverage. Respondents who fit the universe for VERIFY are either coded as not having any coverage (VERIFY = 1) or as having coverage (VERIFY = 2). Note that from 2014 on, VERIFY does not contain any “Yes” responses in the original data.
This variable has three distinct codes that should be considered in analyses of health care coverage. For analyses that do not include any years prior to 2001, researchers may group NIU cases with “Yes” responses to VERIFY in order to identify all persons who had health care coverage. However when comparing estimates with data prior to 2001, users should treat persons coded as “Yes” in the VERIFY variable as uninsured in order to increase comparability. Alternatively, users can analyze the summary health insurance variables instead, which contain imputed verification information for the 1988-2000 period (see HCOVANY).
2025-08-19 · Global Health
Thank you for reaching out and sharing your findings. You’re correct that there is an error in the PHASE variable for Niger: observations coded as phase 4 are actually from phase 3. This will be fixed by the IPUMS Global Health team in the next data release.
To simplify the linking process, I recommend using the wide form longitudinal samples. These can be accessed from the Select Samples page by checking Longitudinal and then selecting the Wide option. Wide form provides pre-linked data that merges variables from across time onto the same row of the panel woman. As a result, there is one record per woman across all survey phases (see the user note on longitudinal formats for more information). If you prefer working with the long form data, you may need to first trim any leading or trailing whitespace from FQINSTID in order to link women across all three survey phases. See strtrim() if working in Stata or trimws() for R.
2025-08-19 · CPS
The harmonized occupation codes already do this work for you! Each OCC/OCCLY will always map to a single OCC1990/OCC90LY code using a modal assignment procedure. This procedure is based on a series of technical papers published by the Census Bureau where observations are double coded into the occupational schemes of the current and previous census year (see OCC1990 for more information). Depending on how specific the occupations that you want to study are, you might additionally consider aggregating occupations into broad categories implicit in the 1990 scheme in order to increase comparability across code vintages.
2025-08-15 · International
Thank you for flagging that these variables use the same code to sometimes refer to different places. We strive to implement consistent coding across the migration variables. Within each variable, the labels should correctly define the reported code. We will review these variables to check for consistent coding across them and try to catch any spelling differences as well.
2025-08-14 · CPS
Thanks for clarifying. This approach makes sense, though you should note that both OCCLY and INDLY use the 1970 classification system in samples from 1971-1982 and the 1980 system in samples from 1983-1991. The two systems are very different (compare 1970 OCC codes to 1980 OCC codes); using only the first digit might not provide you with comparable groups. If you require bridging one or more of these code vintages, I recommend using our harmonized occupation and industry variables: OCC1990 and IND1990. These code occupations and industries across vintages into consistent groups from the 1990 census using a modal assignment protocol (see the variable documentation for more information).
To make use of these harmonized variables with the MORG files, you’d first need to create a crosswalk using IPUMS CPS data (see this blog post for a step-by-step guide). You will need to create the OCC and IND crosswalks individually for each code vintage you plan to use. For example, you can request the 1980 ASEC with both OCC and OCC1990 in order to collapse it into an occupation code crosswalk for samples from 1971-1982. Once you have this crosswalk, you can then use it to recode the vintage-specific 3-digit occupations in the MORG files to OCC1990. You can also aggregate OCC1990/IND1990 into more general occupation/industry groups by using the headings in the variable codes tab.
2025-08-14 · USA
Hi Damla,
The code we provided was intended to demonstrate how you might use these variables to capture the concepts you described, but I assume it will need to be adapted to your specific research application.
In your original post, you specified an interest in creating a series of variables to identify individuals in a number of different living arrangements. It sounds like you are now considering creating a singular variable that reports an individual’s living arrangement in mutually exclusive categories. This would certainly address some of the issues you raised (e.g., persons in living arrangements that are not captured by the variables you outlined previously, potential overlap between living alone and living with others). Additionally, defining a single variable that captures mutually exclusive categories of living arrangements would ensure that your percentages sum to 100.
While I highlighted a number of the IPUMS family interrelationship variables in my previous response, I didn’t describe the variable NUMPREC in detail. This simply reports the number of person records in a household and may be a helpful resources as you seek to compare the likely interrelationships of individuals against the total size of the household.
2025-08-13 · USA
I suspect the origin of the discrepancy is in the difference between the topcode threshold value and the topcode value itself. In the ACS, topcodes are typically applied by the Census Bureau to encompass the highest 0.5% of values in each state for each year. Any case with a value above the threshold has its value replaced with the group’s mean value (i.e., all cases above the threshold are assigned the same value, which is the mean of all their original values). Both the threshold and topcode are reported in the original PUMS topcode documentation linked to in our topcode user guide (see the second column in the table).
For TRANTIME specifically, JWMNTPCT provides the threshold value and JWMNP is the value assigned to topcoded cases. Using your example of a TRANTIME value of 184 minutes I am seeing two states in the 2009 1-year file (MN and MO) that have JWMNP = 184 and jwmntpct = 150. In the cases you include, I see that these cases report arriving 2.5 hours (150 minutes) after their departure time. This suggests to me that while TRANTIME has been top-coded, the arrival and departure times have been masked by implementing the threshold value, though I was unable to find confirmation of this in the documentation. Note that TRANTIME counts the initial minute as time spent traveling. For example, if someone departs at 4:05 and they travel for 5 minutes, they will arrive at 4:09 (minute 1 is 4:05, minute 2 is 4:06, minute 3 is 4:07, minute 4 is 4:08, and minute 5 is 4:09).
2025-08-12 · CPS
The 2014 ASEC was fielded using an experimental design where 3/8 of the total sample received a new version of the questionnaire and 5/8 was given the existing version (refer to our user note on the 2014 ASEC for more information). While this redesign does not significantly impact reporting of ANYCOVNW, the split-ballot approach results in separate variables for each sample that are combined into ANYCOVNW. UH_NOWANYCOV_A1 reports the values for the 2014 3/8 sample, but is NIU for the 5/8 sample. UH_NOWANYCOV14_A1 reports the responses only for the 2014 5/8 sample. Note that you can also identify observations in each sample with the variable HFLAG. After combining both of these unharmonized variables, there will only be a handful of NIU cases that are also present in the original microdata.
2025-08-12 · CPS
It sounds like you are interested in merging harmonized CPS data from IPUMS with the NBER merged outgoing rotation group (MORG) files. Note that IPUMS CPS offers the outgoing rotation group data together with each ASEC (1990-onwards) and Basic Monthly Survey (1983-onwards) sample. The Outgoing Rotation Groups (ORG) variable selection page displays the harmonized ORG variables that IPUMS offers, including the variable UNION. An extract with both ASEC and ORG variables will have a single observation per person, with responses from each component already merged together onto the same person-record.
The NBER MORG file will code occupation and industry based on the Census Bureau classification system that was used contemporaneously (see the MORG documentation for reference); the corollary to these unharmonized values are available in IPUMS CPS as OCC, IND, OCCLY, and INDLY. I am linking to a blog post and forum discussion that include information on merging IPUMS and NBER versions of the CPS data.
2025-08-08 · General
Thank you for sharing these figures with your results. As you note, while these estimates are outside of the margin of error, they are not very far outside. It is up to each individual researcher to determine if their estimates are reasonable or not, but I assume that these differences are likely the result of the summary tables being generated using the restricted file. In addition to the restricted file containing more observations and income values that are not topcoded, the restricted file also contains unrounded income values. For example, wage income (INCWAGE) is rounded in the ACS PUMS to the nearest $1,000 for wages above $50,000. The margins of error incorporate the effects of non-random sampling, but they are unable to consider edits to the data such as rounding.
In addition to the change in 2013 that ceased recoding same-sex married couples as unmarried partners, the ACS also underwent a change in 2019 when the survey began including “same-sex” and “opposite-sex” identifiers for spouses and unmarried couples.
While the individual level microdata allows researchers to run complex multivariate analyses, there are also limitations. Without more context on your research agenda, I will suggest that if you do not require individual-level data, then the ACS tables on IPUMS NHGIS may be more suited to your research.
2025-08-07 · CPS
It would be helpful to see an example of how large these fluctuations are to determine if they are being caused by specifics in the data or in your analysis. While there will be some fluctuations year-to-year, especially for smaller industries and for those that are more responsive to changing economic conditions, using the major industry and occupation groups for state-level estimates should provide relatively stable results. These large groups should also not be affected by changes in classifications over this period of time.
If you do not require individual-level microdata for your denominator, then you might consider exploring the ACS geographically aggregated summary data on IPUMS NHGIS. These use larger samples from the American Community Survey and estimates often come with margins of error shared by the Census Bureau. Using the IPUMS NHGIS data finder tool, you can filter by topic to Occupation and Industry to find relevant tables for each individual year to add to your data cart (note that the 5-year period data are not for annual estimates). One that you may be interested in is table C24050 (Industry by Occupation for the Civilian Employed Population 16 Years and Over), which reports estimates of the number of workers across 13 major industry groups and five major occupation groups (see screenshot below).
In the following screenshot, I’ve combined results from the 2021, 2022, and 2023 industry by occupation tables and provided the labels from the codebook for a select number of industries in Minnesota. Employment appears to be mostly stable across years, with smaller industries such as Information showing greater volatility.
We offer resources to help new users familiarize themselves with IPUMS NHGIS through short video tutorials on our user guide as well as a more detailed FAQ page.
2025-07-30 · USA
Just to let others with similar issues be able to follow along, I replied to your question in your original post.
2025-07-29 · CPS
Thank you for letting us know about this issue and helping improve the data for all. I can confirm that these METAREA codes are in fact erroneously switched from 2016-2022. I will share your note with my colleagues who will fix the codes in a future release.
We would also like to thank you for letting us know of this issue, and thereby improving the data for all users, by offering an IPUMS mug as a token of our gratitude. Please email us at ipums@umn.edu with an address where we can ship your mug to and we will send one your way!
2025-07-24 · USA
I’m glad to hear that you were able to figure out the source of this discrepancy! I’ve shared a note with my colleagues to look into moving the BPL code for Cape Verde to (West) Africa for better consistency.
2025-07-24 · USA
You’re correct that from 2011-onwards, the ACS Public Use Microdata Sample (PUMS) adds synthetic records for persons in group quarters as part of Group Quarters Small Area Estimation (GQSAE). This is confirmed by the 2011 PUMS accuracy document which states that “the GQ population sample has been supplemented by a large-scale whole person imputation into not-in-sample GQ facilities.” This increase approximately doubled the number of group quarters records. I am not aware of any methods to identify these cases in the data. You can find more information about the approach used and an evaluation of its results in this 2013 Census Bureau working paper.
2025-07-23 · USA
Just to let others with similar issues be able to follow along, I replied to your question in your original post.
Also, we ask that users not cross-post the same question in multiple topics (Forum FAQ). If in the future you believe that you posted your question in the wrong category, we’d appreciate if you remove the original post before reposting.
2025-07-23 · General
It’s common for ACS summary table estimates and those derived from the public use microdata to slightly differ. Several factors contribute to this, including the fact that the public-use file is a subset (about 2/3) of the full restricted use dataset. In the case of income variables, differences can be more pronounced due to topcoding in the public data. This is especially relevant for aggregate income measures like FINCP, which is calculated by summing the income components of each family member (each of which is individually topcoded). As a result, income estimates in the PUMS can diverge from those in the published tables, sometimes even falling outside the reported margin of error.
Regarding the effect of changes to family definitions, one possibility might be that this is caused by changes in the relationship to householder variables over time. In 2019, the Census Bureau added some more clarity to the spouse/partner response categories that may have resulted in less data editing and fewer reporting errors (see this PRB overview). Additionally, the 2009-2013 data may be impacted by the inclusion of same-sex married couples (in the 2013 data only). I am unsure how the multi-year summary files handle these changes; it may be that the tables implement the change for all years while in the PUMS the change is only applied to the years after it is implemented.
It would be helpful to know your specific estimates for the 2013 and/or 2018 files to better understand the extent of the discrepancy. You might also consider calculating confidence intervals for your PUMS-based estimates using replicate weights (see REPWT). Even if your point estimates fall outside the published MOEs, there may still be overlap between the confidence intervals derived from the microdata and those in the published tables when using replicate weights.
2025-07-17 · General
The person designated the household head (i.e., the person with RELATE = 101) does not change between survey panels unless that person moves out of the household. An adult child moving in with a parent will not replace their parent as the household head. More broadly, the Census Bureau discontinued the use of the term “head of household” beginning with the 1980 CPS and replaced it with the concept of a “householder”. A householder is a person in whose name the housing unit is owned or rented. The householder is determined when the household enters the panel; they are listed first in their household roster (assigned PERNUM = 1) and are designated the “reference person” to whom the relationship of all other household members is recorded (see the Census Bureau’s subject definitions glossary).
My recommendation is to begin by obtaining the month that each person first appears in the CPS panel. With your dataset that includes all monthly samples from 2021-2023, you can group matching CPSIDV values and sort them by YEAR, MONTH. Generate a new variable for each group of matching CPSIDV values that equals the first YEAR, MONTH combination that they are observed in. You can then compare this value to the first six digits of that person’s CPSIDV value (which is the same as their household’s CPSID value); these first six digits (or entirety of the variable if using CPSID) index the year and month that the household entered the CPS. Therefore, you will be looking for cases where the date the household entered the panel does not match the date of the first appearance of the person’s CPSIDV value. For example, an individual that first appears in the February 2022 sample in a household with a CPSID value that begins with “202201” would have moved in between January and February 2022 (i.e., they became a usual resident; see table 3-2.4 in technical paper 77 for how household membership is determined). Note that you will only be able to identify these movers for households whose first month-in-sample is within the years included in your data (i.e., MISH = 1 in your earliest observation period). If your sample begins in January 2021, you will not have the full history of households who entered before this date.
The forum post that you link to that suggests checking the first 6 digits of CPSID vs CPSIDP is inaccurate; the first digits of CPSID and CPSIDP/V will match regardless of when the individual first appears in the sample. Thank you for bringing our attention to this! We will revise our team’s response to that post to ensure it doesn’t cause confusion.
2025-07-15 · USA · marked as solution
Unpaid family workers (CLASSWKRD = 29) in the ACS refers to those who worked without pay in a for-profit family business or farm for 15 hours or more per week. The type of unpaid caregiving that you describe is generally not identified in the ACS. There are however several other data collections that we offer that you may find more helpful:
-
The American Time Use Survey data on IPUMS ATUS is perhaps the best resource we have for studying unpaid caregivers. Survey respondents provide a time diary of activities that they did in a specific day, which allows researchers to identify the amount of time respondents engaged in various forms of (informal/unpaid) childcare and eldercare. ATUS respondents can be additionally linked to their record from the Current Population Survey (CPS) for further analysis. We provide extensive resources to help familiarize users with analyzing time use data including short video tutorials and training materials with sample code among other support.
-
The Current Population Survey data on IPUMS CPS can be used to identify unpaid family caregivers who reported “taking care of house or family” as a reason for not being in the labor force; this involves using the variables NILFACT (major activity for those not in the labor force), WHYNWLY (reason not working last year), and ACTNLFLY (activity when not in labor force last year for part-year workers). Since the CPS microdata includes records for each household member, you may be able to infer whether the respondent who reported “taking care of house or family” engaged in childcare or eldercare by looking at the records of the other household members. Variables such as NCHLT5 (number of own children under age 5 in household) or DIFFCARE (has personal care limitation) may be helpful. This method will not capture unpaid family caregivers who also had a paid job or reported other reasons for not being in the labor force.
-
The Medical Expenditure Panel Survey data on IPUMS MEPS identifies recipients of informal unpaid home health care in the variable HHUNPDAYS (annual total of days received home care visits from unpaid care providers).
As a side note, IPUMS will be hosting a workshop on using this type of population data for studying formal and informal caregiving at this year’s Gerontological Society of America Annual Scientific Meeting.
2025-07-14 · Time Use · marked as solution
This is a known occurrence as respondents’ answers do not always conform to expected logical patterns. A possible scenario is that some respondents interpreted the RELATEW question “Who was with you? / Who accompanied you?” as implicitly excluding children because the child’s presence is implied in the activity itself. We leave the decision of how to incorporate instances of childcare time without any reported children present up to individual researchers. An example of a similar disconnect between responses about travel in the ATUS is discussed in this blog post.
2025-07-14 · USA
We do not allow for PUMA-based case selection via IPUMS USA because PUMA codes often change when PUMA boundaries are redrawn and because PUMA codes are not unique; they may be recycled over time and they must be paired with a state FIPS code to uniquely identify PUMAs.
You may request data for just Illinois by adding STATEFIP to your data cart and then using the Select Cases tool in the Extract Request menu (available between viewing your cart and submitting your extract for processing). Assuming you’ve also added the variable PUMA to your data cart, you can then filter by this variable once you’ve downloaded, unzipped, and opened the processed data extract.
2025-07-14 · General · marked as solution
The universe tab for INCWAGE notes that in the ACS this variable is reported for all persons age 16+. Significantly, there is no requirement that someone must be employed to receive an INCWAGE value. Your specification therefore likely includes a lot of people who did not earn any wage or salary income and have a zero value for this variable.
You might consider restricting your analytical sample to those with INCWAGE values > 0 (i.e., earned any wage or salary income in the preceding 12 months), or more narrowly to those with EMPSTAT = 1 (i.e., employed in the week preceding the survey). The first case will include those who worked for just part of the year as well as those who worked part time; you can additionally use UHRSWORK (usual hours worked per week) and WKSWORK1 (weeks worked last year) to focus your analysis on full time workers. When I run this analysis using the INCWAGE > 0 restriction in our online analysis tool (see the screenshot of the inputs into the tool below), the median annual wage/salary income estimate for California comes at $52,673.
Note that if you do not require individual-level microdata for your analysis, the geographically aggregated ACS summary data tables available through our spatial data project, IPUMS NHGIS, may be of interest.
2025-07-11 · CPS · marked as solution
OCC2010 is a harmonized coding scheme created by IPUMS to facilitate analyses of occupations across different Census Bureau occupation classification vintages. If you are not working across different vintages, it is not necessary to use this harmonized measure and I would recommend that you use the unharmonized IPUMS CPS variable OCC as those codes directly correspond to the occupation codes listed in the 2010 NHIS codebook; the CPS uses the 2010 occupation codes for 2011-2019 samples and the NHIS uses (an aggregated version of) the 2010 occupation codes for 2010-2018.
As for which variable to use in IPUMS NHIS – if you are not working with more than one vintage of the occupation coding scheme (it sounds like you are not based on your description of working with sample years 2012-2018), there is no need to use the harmonized variable OCC1995; I would again recommend that you use the unharmonized IPUMS NHIS variable OCC. I am linking to the IPUMS NHIS user note on occupation and industry variables in case it is of use of interest to you.
2025-07-08 · USA
As a general policy, IPUMS USA allocates every missing or illegible value in the full count collection as described in our guide to data editing and allocation. Data quality flag variables are provided to indicate which cases have been edited/allocated (see QBIRTHMO). The detailed information on the allocation procedures provides the following information for BIRTHMO:
BIRTHMO:
Month of birth (P)
Flag Name: QBIRTHMO
Universe of Donors:
1870, 1880 & 1950: Persons under age 1 with an unallocated BIRTHMO entry
1900: All persons with an original (unallocated) BIRTHMO entry
Predictor Variables:
AGEMONTH
Procedures:
Assign the same value of BIRTHMO as the previous person who matches the subject on AGEMONTH (1870 and 1880).
If AGEMONTH is not available, assign the same value of BIRTHMO as the previous person in the universe.
Flag Value: 4
As described above, missing and illegible values for BIRTHMO in the 1900 full count are assigned from a nearby donor who has an original unallocated entry. This donor is typically a member of the same household, but can also be from one or two households over in the enumeration order. This method takes into consideration evidence of some birth clustering among siblings, though the allocation is less informative when the month is allocated from someone outside of the household.
2025-07-08 · CPS
Your approach to using HIOFFER together with GRPOWNNW to identify people who work for an employer that offers employer-sponsored health insurance makes sense. The policyholder of current employment-based insurance is certainly being offered employer-sponsored health insurance. One thing to be aware of is that while HIOFFER is restricted to currently employed not self-employed persons, GRPOWNNW is reported for all people regardless of employment status (see the universe tab for GRPOWNNW). You may therefore find cases where someone is unemployed or not in the labor force (or self-employed), but reports being the policyholder for employment-based insurance. Retaining these cases in the numerator will include people who do not “work for an employer.”
In calculating the percent of people employed in an occupation who are eligible for their company’s employer-sponsored health insurance, you should be aware that HIELIG is only asked of those who reported that their employer offers employment-based insurance (see the universe tab for HIELIG). In other words, their employer must offer insurance for the eligibility question to make sense. Your current denominator treats workers whose employer does not offer insurance as not being eligible for insurance. If you prefer to identify how many are eligible for insurance among those whose employers offer insurance, the numerator from your previous ratio would be a more appropriate denominator.
2025-07-02 · USA
The 1900 census was the first that specifically asked about English speaking ability; this information was only ascertained for those age 10+ (see the universe tab for SPEAKENG). In previous censuses, literacy (LIT) recorded whether the person was able to read and/or write in any language.
While documentation for the 1900 census does not provide instructions for who in the household could provide responses for other members, common established practices for interviewing are outlined in the instructions for enumerators in the 1880 census:
It is by law made the duty of each enumerator, after being duly qualified as above, to visit personally each dwelling in his subdivision, and each family therein, and each individual living out of a family in any place of abode, and by inquiry made to the head of such family, or of the member hereof deemed most credible and worthy of trust, or of such individual living out of a family, to obtain each and every item of information and all the particulars required by the act of March 3, 1879, as amended by act of April 20, 1880.
That each and every person more than 20 years of age, belonging to any family residing in any enumeration district, and in case of the absence of the heads and other members of any such family, then any agent of such family, shall be, and each of them hereby is, required, if thereto requested by the superintendent, supervisor, or enumerator, to render a true account, to the best of his or her knowledge, of every person belonging to such family in the various particulars required by law, and whoever shall willfully fail or refuse shall be guilty of a misdemeanor, and upon conviction thereof shall forfeit and pay a sum not exceeding one hundred dollars.
While the default appears to have been to collect information from the head of the household, it could also be collected from the household member “deemed most credible” or from any person over the age of 20. The instructions consistently reference a single household respondent, rather than the entire household being interviewed. Therefore, information on English speaking ability would likely be collected directly from the household respondent for all household members.
An additional note in the instructions states that “the enumerator is not required to accept answers which he knows, or has reason to believe, are false.” It’s possible to imagine a case where a household respondent reports that a child can speak English, but from observation that the enumerator determines that they cannot and will indicate this instead. However, I’m not aware of any documentation that reports how often this would have happened.
2025-07-02 · NHGIS
You may approach this using either the microdata on IPUMS USA or the summary data tables on IPUMS NHGIS:
IPUMS USA
It’s possible to use 1-year samples and a simple allocation model to handle cases where PUMAs straddle MSA boundaries. This approach has been suggested in other forum posts (e.g., allocating microdata from PUMAs to cities or between vintages of PUMAs) by distributing households based on population shares in intersecting units. For this, you would need a crosswalk between PUMAs and 2023 MSA delineations. IPUMS provides crosswalks between 2020 PUMAs and 2023 MSAs, but not yet for 2010 PUMAs, which you’d need to analyze years prior to 2022. To create such a crosswalk, you can combine:
From there, you could estimate the overlap between PUMAs and MSAs using tract-level counts of rental units, which would allow you to compute allocation weights specifically for rental housing rather than total population. These are available in 5-year summary ACS data tables on IPUMS NHGIS. One special case to be aware of is Connecticut, where counties were replaced in 2022 by planning regions. This complicates efforts to match 2010 PUMAs to 2023 MSAs, since the newer MSAs are based on these updated regions (see this forum post for a general approach to this issue).
Even with careful geographic allocation, sample size is a concern. Many mid-size MSAs may have fewer than 100,000 rental units, so even with 1% microdata samples, annual rent estimates may not be statistically reliable due to high sampling error. For this reason, it may be a good idea to aggregate data over several years to analyze (non-overlapping) 3- or 5-year periods.
IPUMS NHGIS
You will need to use the 5-year summary data since 1-year ACS summary tables are only available for geographic areas (in your case, counties) with populations of at least 65,000. While 5-year data expands geographic coverage, it is not suitable for constructing annual panel datasets since about 80% of each 5-year sample overlaps with the previous/next sample.
You can access relevant rent distribution data by filtering by County as your geographic level and Rent and Renter Costs as your topics filter in the data finder tool. This should allow you to locate table B25063 Gross Rent, which provides the number of rental units in each of 26 rent intervals. You can then sum counts across counties to approximate the gross rent distribution for each MSA. While this does not give you the mean or median rent, this more detailed data about the distribution can be combined with an interpolation method that you might use to approximate the statistic that you’re looking to calculate. You will also want to keep in mind that your standard errors may be relatively high for smaller counties; this guide to variance estimation using the summary data includes worked examples that may be helpful.
2025-07-01 · CPS
The current universe statement for HIOFFER reads “Respondents who were not covered by employer-based health insurance plans who are employed and not self-employed.” Stated differently, this includes anyone currently employed (excluding self-employed) who is not the policyholder of any current employment-based health insurance coverage. Therefore, anyone who is the policyholder for coverage will be not-in-universe for HIOFFER. I see how the current universe statement for this variable can be confusing and will consult with my colleagues on how it can be better clarified.
To confirm this, I referred to the 2024 ASEC codebook documentation for the variable ESIOFFER (the variable that is recoded to create HIOFFER). The codebook describes the universe for ESIOFFER as:
(NOW_OWNGRP = 0 or 2) and (PEMLR = 1 or 2) and (PEIO1COW = 1,2,3,4,5,8,9, or 10)
I will describe each of these components.
- NOW_OWNGRP refers to this policyholder component and restricts from the universe anyone with NOW_OWNGRP = 1 (i.e., responding “yes” to being the policyholder of current employment-based coverage). You can also see this relationship by cross tabulating HIOFFER with GRPOWNLY (“Policyholder for employment-based insurance”).
- PEMLR additionally restricts the universe to currently employed persons.
- PEIO1COW cuts out self-employed persons.
2025-06-30 · General
I believe that the variable for self-assessed mental health that you are looking for is MHLTHRD, which was just released by the IPUMS MEPS team last week!
Generally, the search tool is useful for looking up keywords (e.g. “mental”), but may be less helpful with searching for specific variable names, which will often differ between IPUMS and the AHRQ files. Alternatively, the drop down menus from the variable selection tool can be used to find related variables. The menu is organized by the record type that the variable is located on (annual, round, condition, event, and prescribed medicine), so it is easiest to find them when you know which category the variable that you’re looking for falls under. MHLTHRD is asked of respondents in each round of the survey, and is therefore grouped with other round-level variables in the Round → Conditions category. Other variables, such as the mental component score (MCS), are released annually and are available under the Annual → General Health → Adult Menu Health category (see the screenshot of the drop-down menu below).
The MCS was calculated by the Agency for Healthcare Research and Quality (AHRQ) using a proprietary algorithm that weights responses to the Short-Form 12 (SF-12) from the Adult Self-Administered Questionnaire (SAQ). However, the SF-12 was replaced by the Veteran’s RAND 12-item (VR-12) in 2017 and used to construct the AHRQ-provided MCS for samples from 2017-onwards. While the questions in the SF-12 had a five-point response scale, the VR-12 questions had a six-point scale, which affected comparability with earlier samples. A bridging algorithm was developed and has been applied to both the VR-12 PCS and MCS score variables (VPCS42 and VMCS42 in the original AHRQ files). More information is available in the 2022 Full Year Consolidated documentation file on the AHRQ website.
IPUMS MEPS does not currently offer the MCS from 2017-onwards. I will share your interest with my colleagues who can look into extending availability of this variable. In the meantime, you can obtain MCS directly from the AHRQ full-year consolidated files and merge this data with an IPUMS extract (see our user guide on merging for detailed instructions).
2025-06-25 · General
Based on your description, I do not see any immediate reason for restricting your links to a single month-in-sample value. Persons with a month-in-sample (MISH) value between 5-8 in the CPS ASEC are scheduled to complete their final interview in that same year and, if selected, will be interviewed for the ATUS three months after. For example, if someone were MIS 5 in March 2023, they would be MIS 8 in June 2023 and eligible to be interviewed for the ATUS sometime around September 2023. While some households in the sample will not complete their final CPS interview and therefore will not be eligible for the ATUS, you can significantly increase your sample size by retaining households in the ASEC that are eligible together with those who may become eligible to link in that year. This does not hinder your ability to construct a two-year longitudinal ASEC panel; anyone with MISH values between 5-8 in one ASEC can typically be linked to the previous year’s ASEC (provided that they are not part of the ASEC oversample). Also, note that you can link persons across any of their CPS panel months; there is no inherent reason to restrict to those who link between the ASEC samples unless there are specific ASEC variables that you require for your analysis.
Since both the CPS and ATUS are not completely random samples, you will need to carefully consider your weighting strategy when analyzing this linked sample. There is no official recommended way to do this; it may be helpful to consult the literature to see what other researchers have done. One method that uses an OLS regression with demographic characteristics to predict linking using the full ATUS sample is described in these linked CPS-ATUS supplement files.
Your suggested method of comparing household rosters over time makes sense to me. While you will not observe records of individuals before they move into the sampled household, you’ll still be able to observe these compositional changes. You can also use this method to identify cases where the parent moved in to their child’s home. Note that the ASEC includes person-level migration status variables MIGRATE1, MIGSTA1, and WHYMOVE, which may aid in your analysis.
2025-06-25 · USA
Both the 1850 and 1860 full count federal census microdata on IPUMS USA include the variable BPL (birthplace) for all persons. Additionally, the IPUMS Multigenerational Longitudinal Panel (MLP) provides de-identified census microdata that links persons between their appearances across years in the full count census. By requesting a linked 1850-1860 file, you would be able to identify people who moved to California between the two decennial censuses. However, as you note, it would not allow you to separately identify those who moved in from 1851-1855 from those who moved in after the rush in 1856-1860.
IPUMS USA does not have data from the 1852 California Census. If you were to obtain this data, you would certainly want to match persons to the 1850 full count data by name. Note that through the North Atlantic Population Project (NAPP), IPUMS-International provides microdata that includes the first (NAMEFRST) and last (NAMELAST) names of all persons in the 1850 federal census that you might use for this project. Alternativity, you may apply for a restricted use license to access this identifying information on IPUMS USA.
2025-06-25 · Time Use
The ATUS codebook notes that “there is one record for each ‘who’ code reported.” You can see this reflected in the enumeration instruction screenshot from the ATUS questionnaire (pg. 24). Enumerators cannot enter the same ‘who’ code multiple times to indicate the total number of people who were with the respondent at the time of the activity. Only one ‘who’ record is created for each ‘who’ code provided.
While each household member has their own corresponding ‘who’ code, making it possible to identify the total number of household members who were present, non-household members are grouped into different ‘who’ categories (e.g., respondent’s non-household “parents”, “friends”, “co-workers”, etc.). In the case of co-workers for example, the data does not report the total number of co-workers who were with the respondent but combines them into a single record. In cases where the person is a member of the respondent’s household, their roster line number will be reported in LINENOW. This allows researchers to obtain additional information such as their age AGEW and sex SEXW. Note that the variable WHOLINE is simply an identifier for the who record; it is constructed to sequentially number each who record within an activity regardless of the identity of the actual person.
2025-06-23 · USA
IPUMS USA does not distribute microdata from the 1940 census of housing. The only housing variables available are those that were asked as part of the population schedule questionnaires (see the 1940 questionnaire template). In 1940, these included questions regarding ownership (OWNERSHP), home value (VALUEH), monthly rent (RENT), and farm status (FARM). Vacancy status was not collected as part of the population schedule during this period, but was included in a separate housing schedule to the census. In the 1960 census forward, data collection for the household schedule and population schedule were combined.
Geographically aggregated counts of vacant units, digitized from the published volumes of the 1940 Census of Housing, are available for download through our spatial data project website, IPUMS NHGIS. When using the data finder tool to search for tables of interest, you can filter by year (1940) and topics (Occupancy/Vacancy and Use) to find the tables that are most relevant. You may be particularly interested in tables NT50 Vacant Dwelling Units for Sale or Rent (by state & county) and NT29 Vacant Dwelling Units by Market Status (by census tract for select tracted cities).
2025-06-20 · CPS · marked as solution
Each observation in the CPS microdata is an individual respondent to the CPS interview in a particular month. The structure of the CPS rotating panel is such that sampled households are interviewed for four consecutive months, experience an eight month break with no interviews, and are then interviewed monthly for an additional four consecutive months before exiting the CPS panel. Respondents are first asked a battery of labor force and demographic questions as part of the Basic Monthly Survey (BMS) each month and then may be asked additional questions if that month includes supplemental data collection. Eligible household members in January of each even-numbered year are asked a series of questions regarding displaced worker status as part of the Displaced Worker Supplement. Meanwhile, household members in March of each year are asked the Annual Social and Economic Supplement (ASEC) questions. Therefore, in order to link variables across these two supplements, it is necessary to first link person records across these two interviews in the panel.
To do so, you will need to request a data extract that includes both supplements, the variables from each supplement that you are interested in, and the validated linking key CPSIDV. Your data extract will be in a long format, where persons will have one record for each month in which they were interviewed. For example, if you included selected January and March of 2022, persons interviewed in both supplements will have two records in the data file: one with their responses to the Displaced Worker Supplement and one with their responses to the ASEC supplement. To analyze variables from both supplements, you will likely want to reformat the data in a panel such that each observation includes responses from both supplements. This is relatively straightforward to do in Stata using the reshape, wide command. We provide additional sample code on this data workshop materials page. In R, this can be done using the pivot_wider function in the tidyr package.
Due to the structure of the CPS rotating panel, about 50% of respondents interviewed in January are eligible to be interviewed and included in the following March ASEC. You can visualize this using the IPUMS-CPS Rotation Pattern Explorer (RoPES) tool. In the screenshot below, I’ve used the tool to display the months in which respondents to the 2012 Displaced Worker Supplement are eligible to be interviewed. Note that in addition to the 50% of respondents in the following (2012) ASEC, up to 25% of those eligible for the 2012 Displaced Worker Supplement were interviewed in the preceding year’s (2011) ASEC and that up to 25% will be interviewed in the next year’s (2013) ASEC. Therefore, if you want to include all possible links between the two supplements, you will need to request ASEC samples from 2011-2019 together with the 2012-2018 Displaced Worker Supplement samples.
2025-06-20 · CPS
The sampling weights are designed such that each monthly sample represents the total sample universe. The sum of WTFINL in January 2023 therefore approximates the total US noninstitutional resident population in that month; this is the case for each month in your sample. When summing WTFINL across the 36 months in your sample, your estimates will be inflated 36x. To obtain aggregate estimates for the 2023-2025 period, you will need to first divide WTFINL/HWTFINL by the total number of months in your sample. Alternatively, If you want to obtain monthly estimates, you will need to generate your counter for each month and year separately.
2025-06-20 · International
Thank you for bringing this to our attention. The IPUMS-International team is working on a solution to these and similar issues relating to links for industry/occupation codes as part of a systemic review. In the meantime, please use the source variables NG2006A_MNOCCP and NG2007A_OCC, rather than IND, to analyze industry in these samples.
2025-06-19 · Global Health
I will share some general comments about linking between units of analysis and then address your specific question.
The Line Number of Individual Persons table in the IPUMS MICS linking user note that you referenced provides the variable that reports a person’s line number depending on the unit of analysis. A person’s line number will be the same across units of analysis (i.e., a woman’s LINENO value in datasets that use household members as the unit of analysis will be equal to her LINEWM value in datasets that use women as the unit of analysis). These variables will only uniquely identify individuals within a household; to uniquely identify records within a single sample you will also need to use the variables CLUSTER and HHNO; if you are pooling together multiple samples you will also need to include the variable SAMPLE.
In the case of linking child (Age 0-4) records with the corresponding individual women variables, the child unit of analysis variable LINEMC will report the line number of the mother or caretaker of the child. If this woman was a woman respondent, it could be linked to the corresponding woman unit of analysis by matching a child’s LINEMC value to a woman’s LINEWM value. You will need to rename the variables so they are the same between the different files/units of analysis. You will also need to merge on SAMPLE, CLUSTER, and HHNO. One woman may have multiple children, so you will need to carefully consider which file you have in memory and which file you are merging on. The IPUMS MICS linking user note recommends having the child records in memory (as the base or “master”) dataset and then merging the woman file onto it because this is a many-to-one merge.
2025-06-19 · International
STRATA is created by IPUMS-International by assigning a unique identifier to groups of geographically adjacent households in order to improve accuracy of standard error estimation. Households grouped into the same strata do not necessarily reside within the same small geographic area such as village or town; in the China 1990 sample I can only confirm that they reside in the same county (GEO3_CN1990). You can read more about the construction of strata in this IPUMS working paper.
Note that you can find the source variables (e.g., CN1990A_0030) for each integrated variable (e.g., STRATA) by referring to the integrated variable’s Source Variables tab. In the case of STRATA, you can see in this tab that CN1990A_STRATA (the name assigned to CN1990A_0030) is the source variable for STRATA. In this case, the source variable was created by IPUMS-International and will be identical to the data in the integrated variable.
2025-06-18 · USA · marked as solution
I sounds like you’re asking about obtaining the unsubsidized rent amount for those for receive housing subsidies? This information is not readily available in the ACS.
The ACS is a self-administered questionnaire (see the full questionnaire), meaning that data is restricted to information respondents already have. Most housing subsidy programs, such as Section 8, do not provide recipients with information on what the negotiated contract rent for their home is. People will therefore only report how much they actually paid for their housing, rather than how much the landlord received. While RENTGRS notes that it reports monthly gross rent inclusive of contract rent (RENT) and utilities, “contract rent” in this case refers to the amount respondents paid for rent exclusive of utilities and other housing-related costs. You can confirm this by referring to the Questionnaire Text tab for RENT.
2025-06-11 · Time Use
The 2023 ATUS survey activity lexicon codes “checking Facebook/Instagram” under Socializing, Relaxing, and Leisure → Relaxing and Leisure → Computer use for leisure (exc. Games).This corresponds to ACTIVITY = 120308 in IPUMS ATUS. Watching YouTube videos receives the same second-level code, but as you note it gets assigned to Television and movies (not religious) instead (ACTIVITY = 120303).
Reviewing other example activities within the television and movies category in the lexicon, it appears this code (120303) is intended to capture more traditional video consumption such as TV shows or films. By contrast, short-form video content like reels, tiktoks, and shorts seems more consistent with the computer use for leisure category (120308), especially when accessed through social media platforms. Facebook and Instagram both have video content and “checking” these platforms would logically involve viewing short videos on there as well. However, I wasn’t able to find any documentation that would confirm this interpretation. It’s possible that viewing short-form videos is somewhat of a gray area that can be coded into either category depending on how the respondent described the activity and how it was interpreted by the coder.
2025-06-10 · USA
While the variable COUNTYFIP identifies counties or county equivalents such as Connecticut Planning Regions, the comparability tab for COUNTYFIP notes that IPUMS USA cannot identify all counties in recent samples. This is because the ACS Public Use Microdata File (PUMS) that IPUMS USA harmonizes does not report the county (or planning region in the case of CT) that a respondent resided in; state and PUMA (Public Use Microdata Area) are the only geographic identifiers provided. Where PUMA and county boundaries are coterminous, IPUMS USA identifies the county that PUMA residents resided in. More specifically, the protocol assigns all respondents in a given PUMA to a county if and only if the county was coterminous with a single PUMA or the county contained multiple PUMA, none of which extended into other counties. All of Connecticut’s eight counties were identified in the IPUMS ACS samples from 2006-2021. IPUMS USA replaced identification of Connecticut’s historical counties with Planning Regions starting with the 2022 ACS. However, the country-wide change in PUMA boundaries by the Census Bureau in 2022 combined with the shift in boundaries from county to planning regions affected identification.
In the case of Connecticut’s Capital Planning Region, it appears that though Connecticut PUMAs 20201, 20202, 20203, 20204, 20205, 20206, and 20207 closely follow the borders of the region, Connecticut PUMA 20203 excludes around the town of Stafford (see map below obtained from the IPUMS USA 2020 PUMA definitions page). As a result, around 11,000 total people who live in the black circled area are officially in the Capital Planning Region, but are only identified as residing in Connecticut PUMA 20301 (this translates to roughly 1.2% of the total population of the Central Planning Region). This is because PUMAs are designed to contain a population of at least 100,000 in order to protect the privacy of respondents. Since the population of the Northeastern Planning Region is slightly below this threshold, the Census Bureau assigned it a part of the neighboring region. Due to this mismatch, we do not assign respondents to either the Capital or the Northeastern Planning regions since this will cause county-level estimates to diverge from Census Bureau published estimates that use their internal file.
You might identify respondents who reside in the Capital Planning Region, sans Stafford, using the seven combined PUMAs listed above. However, you should be aware how this will affect your final estimates. If you do not require individual-level microdata, you can obtain geographically aggregated ACS summary data for all counties and county equivalents through our spatial data project, IPUMS NHGIS.
2025-06-06 · CPS
While I cannot review the code for your specific analysis, your approach to calculating industry group shares by year/month/state seems reasonable to me. The only thing that sticks out is that you note that you obtain the dataset at the CPSIDP level. CPSIDP links persons across their appearances in the CPS panel and is used for longitudinal/panel analysis. As a result, the same CPSIDP values will appear in up to eight monthly samples. Based on your question, I recommend approaching your data as a repeated cross-section; each individual is then identified by a unique combination of YEAR, MONTH, SERIAL, and PERNUM.
You are correct to restrict to only persons with EMPSTAT = 10 or 12 since industry (IND) is provided for currently employed persons as well as for unemployed persons looking for work and persons not in the labor force who had worked in the preceding 12 months (see the universe tab for IND).
I can share a few edits that you might consider in your approach:
- WTFINL is the weight typically used for analyses of CPS Basic Monthly Survey (BMS) samples. However, you might consider using the composite weight COMPWT instead. COMPWT is used for replicating BLS labor force estimates since it increases the reliability of estimates of month-to-month change.
- You will want to be aware of changes in Census Bureau industry classifications across your time period. IPUMS CPS provides the harmonzied industry variable IND1990 which adjusts for changes to codes and uses a modal assignment protocol to code industry codes that combine or split over time (see our chapter on harmonizing occupations and industries for more information).
- You may find that the small number of observations in your year/month/state/industry cells result in estimates with large margins of error. In addition to aggregating your industry groups to increase sample sizes, you might also consider using the larger American Community Survey samples on IPUMS USA or the aggregated ACS summary data on IPUMS NHGIS.
2025-06-04 · General · marked as solution
I took a look at your most recent data extracts and noticed that they included linked longitudinal ASEC samples; between this and your reference to ASECWT_1 in your code, I assume you are seeing the unexpected population counts using a linked, longitudinal file.
There are a few differences when it comes to working with the linked samples as opposed to the cross-sectional data. We provide a link to documentation on these linked samples on the sample selection page (right above the checkboxes for specific samples). The documentation notes that these samples should be weighted using LNKFW1YWT, which provides additional adjustment for the probability that a respondent links across the ASEC samples.
The reason that ASECWT_1 produces this much smaller population size is because the linked files only include records of persons that are linked to the following year’s ASEC. There are two main factors that affect a person’s ability to be linked: their month-in-sample (MISH) and whether they are part of the ASEC oversample (ASECOVERP). As a result of the rotating panel structure, only persons in their first four months of the survey (MISH >= 1 & MISH <= 4) will be sampled a year later in the following ASEC. This effectively cuts the sample that can be linked in half. Additionally, longitudinal extracts do not currently link persons who are part of the ASEC oversamples (see this working paper for a discussion of the oversample issue and solutions the IPUMS-CPS team is exploring). Finally, even if someone satisfies these criteria they will not necessarily appear in the linked sample if they refused to respond to the survey or moved out of the sampled housing unit. LNKFW1YWT adjusts for this by using a raking procedure that recalibrates ASECWT based on the population that was linked; you can learn more about weighting linked datasets in our user note.
2025-06-02 · General
It is possible to estimate housing vacancy rates within a geographic area, but it requires downloading an extract consisting of only household records. You will want to start by adding the variables VACANCY, STATEFIP, and CITY/MET2013 to your data cart. When you go to check-out your cart, you will be presented with an extract request screen (see screenshot below) where you can change the data structure to include only household records. You can also use the Select Cases tool to filter the data to the states/cities/metro areas that you’re interested in. Please note that not all cities and metros are identifiable in the public use file; sub-state geographies are imperfectly identified following our assignment protocol (see the CITY and MET2013 variable documentation for more information). Once your extract has been submitted and processed, you can download the file, decompress it (we recommend 7-Zip or the Unarchiver), and load it into your stats package. When tabulating VACANCY, you will want to weight your data using the household-level weight HHWT.
You can also obtain this data from the published ACS summary tables through our spatial data project, IPUMS NHGIS. These tables summarize data from the ACS microdata but may be more accurate since they are tabulated from the larger restricted microdata file and can perfectly identify cities and metro areas since they do not face the same confidentiality restrictions. By using the data finder tool (see below) and filtering by topics to Occupancy/Vacancy and Use , you can find and add data from table B25002 (Occupancy Status) to obtain vacancy rates for your place of interest.
2025-06-02 · USA
The PUMA of residence is released by IPUMS as an unrecoded variable; it is only reported using the sample’s contemporary boundaries:
- In samples collected from 2005-2011, PUMA is only reported using 2000-vintage PUMA boundaries.
- In samples collected from 2012-2021, PUMA is only reported using 2010-vintage PUMA boundaries.
- In samples collected from 2022-2031 (expected), PUMA is only reported using 2020-vintage PUMA boundaries.
In the past, multi-year ACS files that include years from different PUMA vintages have reported the contemporaneous vintage for the survey year (e.g., in the 2008-2012 5-year PUMS file, the 2008 data would use 2000-vintage PUMAs and 2012 would use 2010-vintage PUMAs); it was therefore not possible to systematically obtain the exact PUMA of residence for an alternate vintage. However, beginning with the 2023 5-year ACS, which includes data collected from 2019-2023, the data report PUMA of residence using 2020-vintage PUMA boundaries for all households regardless of the year the data was collected. The Census Bureau has additionally re-released the 2022 5-year ACS file using 2020-vintage PUMA boundaries for all households; IPUMS USA will integrate this data in an upcoming release.
For your specific application, IPUMS does not currently offer a variable that would allow you to infer the 2020-vintage PUMA of residence in data collected before 2018. IPUMS USA offers a geographically harmonized PUMA variable (CPUMA0010) that provides a consistent PUMA definition for samples collected from 2005-2021 by bridging 2000- and 2010-vintage PUMAs. It does so by aggregating one or more 2010 PUMAs that, in combination, align closely (within a 1% population mismatch tolerance) with a corresponding set of 2000 PUMAs. As mentioned in this post, we plan to add a new CPUMA1020 variable in the future to bridge the 2010 and 2020 PUMA boundaries.
In the meantime, there are a few different approaches you might consider in order to run your analysis across the entire 2005-2023 period:
-
Run your analysis on the county level and restrict it to the five Tennessee counties that are identified across the entire period (Blount, Davidson, Rutherford, Shelby, and Williamson).
-
Create your own crosswalk that matches 2020-vintage PUMAs to consistent PUMAs (CPUMA0010). To do so, you will need to consult the CPUMA0010 summary file for the list of 2010 PUMAs within each consistent PUMA and match those to 2020 vintage PUMAs using the 2010-2020 PUMA crosswalk. For example, in Tennessee, 2010 PUMAs 2001, 2002, and 2003, which compose CPUMA0010 941 very closely map on 2020 PUMAs 3401, 3402, and 3403. You can then identify this CPUMA across all years.
-
As outlined in this forum post, you can use a probability approach to allocate shares of people from one vintage of PUMAs to another based on the proportion of the population in each intersection between different PUMAs. That post describes how to go from 2010 PUMAs to 2020 PUMAs or vice versa. You could use the same technique to go from 2000 PUMAs to 2010 PUMAs (and then do your analysis using 2010 PUMAs), or you could allocate from 2020 PUMAs to 0010 ConsPUMAs (and do your analysis using ConsPUMAs). This would require joining the CPUMA0010 2010 PUMA Components file to the 2010-2020 crosswalk by 2010 PUMA ID. This will be a one-to-many merge since the crosswalk will have one or more observations for each 2010 PUMA. You will then need to sum the populations of the 2020 PUMA segments across the consistent PUMAs to get the percent of each PUMA’s population that is in a particular consistent PUMA.
2025-05-29 · International
All of the IPUMS International samples are listed on the sample information page. There is a single sample of the 1971 Indonesia Census which consists of 634,642 person records. Though this represents a relatively small fraction of the population, the data include sample household (HHWT) and person (PERWT) weights that when used allow researchers to obtain estimates that are nationally representative. You can find additional information about using weights in this FAQ question. When analyzing smaller subpopulations, you should tabulate the unweighted sample size and consult your standard errors to ensure that you are being appropriately cautious about making population inferences.
2025-05-29 · International
Thank you for bringing these discrepancies to our attention. Since this appears to be a repeated pattern, the IPUMS-International team will take a closer look at all of the OCC and IND code links that we provide. In the meantime, I recommend using the Source Variables tab to find the correct labels (as mentioned in this post). Please let us know if you find instances where the labels for the variable in the Source Variables tab does not map correctly to the downloaded data. You may also be interested in taking a look at the variable INDGEN (recoded general industry), where the IPUMS-International team has harmonized the original industry data to a consistent classification system.
2025-05-28 · General
I suspect the issue with the output you are seeing is that the file has not been decompressed or loaded correctly. It might be helpful to review these instructions for opening IPUMS extracts.
Since our data are compressed and fixed-width files (*.dat.gz), you will need to decompress or unzip them before using them. We recommend 7zip as a free decompression software for Windows and The Unarchiver for Macs. Once you’ve decompressed the file, you will need to input it into a statistical program; the linked instructions provide code for Stata, R, SAS, and SPSS. For R users we provide additional documentation on our ipumrs package website. If necessary, you can find details on how to change the format to .csv (which can be opened in Excel) in this blog post (which also covers decompressing the data).
2025-05-27 · International
After reviewing our documentation, I was unable to find any issues with this source variable. Due to time constraints, we occasionally do not integrate all variables that are included in the original source data. We appreciate hearing from the research community about which variables would be most useful; I will share your interest with the IPUMS-International team so that they can look into including this in a future data release.
2025-05-27 · International
Thank you for bringing these discrepancies to our attention. You can find the labels for IND codes in the France 1999 sample in the source variable FR1999A_INDCITI. We will revise the codes list to direct to the FR1999A_INDCITI page.
Source variables correspond to the variables in the original datasets and serve as inputs for harmonized IPUMS variables. IND does not recode the original industry data, but collates the sample-specific industry source variables (e.g., FR1999A_INDCITI) together into a single variable. Therefore, you can also obtain the same unedited industry data together with the corresponding labels by checking the IND source variables tab (see the screenshot of the tab below). This tab will display the source variables used for IND for all of the samples in your data cart.
2025-05-21 · USA
Although the person who fills out the ACS questionnaire is recorded on the front page of the ACS questionnaire, there is no variable in the Public Use Microdata Sample (PUMS) that identifies who this individual is. I can imagine that the person completing the form would most often list themselves as the household reference person (i.e., RELATE = 1). The survey instructions specify that the reference person should be someone in whose name the housing unit is owned, being bought, or rented. Therefore, if the individual completing the form did not meet this criteria, they are likely to designate someone else as the reference person. You may be able to obtain information on who actually completed the questionnaire by applying for access to the restricted use ACS microdata through a Federal Statistical Research Data Center (FSRDC).
2025-05-21 · USA
Thank you for bringing this discrepancy to our attention. Based on a review of the 1970 and 1980 PUMS documentation, -9900 is indeed the smallest value in the 1970 samples and refers to a loss of $9,900 or more; -9995 refers to a loss of $9,900 or more in 1980. I am sharing a note with my colleagues to explore imposing additional consistency in this bottom-coded value across years.
2025-05-21 · International
Thank you for letting us know! I have alerted my colleagues to have this link fixed. In the meantime, here is the correct link to the industry codes for Chile 2017.
2025-05-19 · International
You’re correct that not all variables are available for all samples. The documentation for each variable includes an availability tab (see OWNERSHIP) that lists the samples for which it’s available. Availability is dictated by the questions that were asked in the corresponding sample, the specific data shared with IPUMS, confidentiality agreements regarding what data we are allowed to release, and whether the source data has been harmonized into the corresponding variable.
For example, the 2002 Chile Census asks residents whether the dwelling they occupy is owned in full, owned with a mortgage, rented, ceded in return for work or services, or free (see Question 3 in the 2002 questionnaire). Meanwhile, the 2017 Chile Census only asks whether the housing unit is privately owned or a collectively owned unit. For private units, enumerators also recorded what type of unit this was with options for “house” and “apartment”, but this information is not sufficient to code household tenure in OWNERSHIP.
In other cases such as Austria (1971), Canada (1971), and the Netherlands (1960-2011) questions regarding tenure were asked, but due to disclosure rules or other reasons the data provided to us do not include this detail.
In a few cases, the data may exist in a sample-specific source variable that has not yet been integrated into OWNERSHIP (e.g., FR2006A_OWNSHIP from the France 2006 sample) that you can add to your data extract. You can search for these types of unharmonized variables using the search tool. To streamline the search process for these, I recommend that you first select only the samples from your list that do NOT have data for OWNERSHIP. Within the search tool, you should then limit your search to “Limit variables by selected samples” and check the “include source variables” option (deselect the “include harmonized variables” option to see only the source variables). I would recommend search terms such as “rent”, “sublet”, or “ownership”. After you have added the source variables to your data extract, you can update your extract to include all samples of interest and add the remaining variables.
2025-05-16 · General
For clarification, survey respondents can refer to households who responded to the CPS or to persons represented in respondent households. Restricting your analytical sample by PERNUM=1 will give you the number of responding households, which will be smaller than the number of persons represented in the survey as households can contain more than one person.
It is much more straightforward to obtain this value by reviewing the HHINTYPE codes tab. By selecting the case-count view on the codes tab for this variable, you can obtain the total number of interviewed and non-interviewed households for each sample in your data cart (or for the default samples if your cart is empty). In the screenshot below, you can see that 40,092 households were interviewed, 19,958 had a type A non-interview (for reasons such as refusal to participate and temporary absence), and 9,336 had a type B (vacant or occupied by persons ineligible for interview) or type C (housing units that were demolished, converted to storage or business use, or included in the sample by mistake) non-interview in March 2025.
You can also review the sample size page to obtain the total number of people for which data was provided in a given sample. While the sample sizes provided on this page combine both interviewed and non-interviewed households, person records are located only in interviewed households. Non-interviewed households have no person records. The screenshot below shows that information was collected on 93,649 persons from among the 69,386 total households of which 40,092 were interviewed and included at least one person.
2025-05-16 · USA · marked as solution
As you have discovered, there are a number of different resources for examining occupations across years of the ACS that include a change in the occupation coding scheme.
- Microdata files: The 2006-2010 5-year and 2008-2010 3-year ACS microdata files code respondents’ occupations based on the year data was collected. Records with MULTYEAR < 2010 are based on the 2000 SOC (which inform the 2000/2002 Census Occupation Codes) and those with MULTYEAR = 2010 are based on the 2010 SOC (which inform the 2010 Census Occupation Codes).
- Summary files: The excerpt that you cite notes that for the creation of 2006-2010 summary tables that bridge this change, Census Bureau experts reassigned the occupations of each respondent interviewed in 2006-2009 to a new 2010 code. We provide these types of Census summary tables on our spatial data project website, IPUMS NHGIS.
- Crosswalks: The Census Bureau produces a conversion rate crosswalk that allows researchers using the microdata to see the estimated percent of people in each old occupation code (e.g., 2000/2002 Census Occupation Codes) who would be assigned to each new code (e.g., the 2010 Census Occupation Codes). The comment in this IPUMS CPS guide to occupation code changes notes that this conversion rate crosswalk is available for comparing the 2008 and 2010 data in reference to analyses of the 2008-2010 3-year ACS microdata file. Note that I can no longer find this 3-year crosswalk on the Census Bureau’s website.
On a related note, it is unclear to me which years of data the conversion factors are based on; I was not able to find detailed documentation on this. I assume that the factors in the 3-year crosswalk to use data from 2008 and 2009 to calculate conversion factors for 2010 occupation codes. However, the Census Bureau also provides a document with conversion rates using the 2006-2010 5-year file on its Industry and Occupation Code Lists and Crosswalks page and the values in that document appear to be identical to those for the 3-year crosswalk. While I would expect the conversion rates to be similar overall, I would expect minor differences when using two additional years of data. You may want to reach out to the Census Bureau to determine the basis used for these values. Your interpretation of the note regarding the 2012-2018 crosswalk makes sense to me.
2025-05-15 · General
Thank you for your patience while we looked into your question.
IPUMS extracts contain all of the person and household records as the files downloaded directly from Census (records of non-interviewed households can be obtained by requesting a hierarchical extract). Since PERNUM is created by IPUMS, I’m assuming that you’re using the line number variable PULINENO (provided by IPUMS in the variable LINENO) to obtain counts in the original Census file and then comparing this number to PERNUM in your IPUMS extract. The difference in the number of records that you are seeing therefore is explained by households that have a person with PERNUM = 1, but no one with PULINENO = 1. When accounting for these households, both files will show 40,092 respondent households in the March 2025 Basic Monthly Survey (BMS).
PERNUM is created by sequentially numbering persons within each household for each monthly sample as they appear in the microdata. Meanwhile, PULINENO refers to the line in the household roster a particular person is enumerated on across their time in the panel. Since the CPS sample selects households (i.e., physical housing units) rather than individual people to be surveyed, people who exit the household (by moving out or through death) during the CPS panel are not recorded in subsequent survey months. In such cases, their PULINENO value (unlike PERNUM) is not reassigned to a different household member in the following survey month. The household will therefore have no members with that particular PULINENO value. The same procedure applies if all residents of the household move out and are replaced with a new family that moves in. This can result in households with no members who have PULINENO = 1.
Additionally, there are cases of households where no one has ever been assigned PULINENO = 1 across their time in the panel (including households in their first month of enumeration). I was unable to find information on what this might indicate and suspect that these are cases where an individual was initially enumerated and assigned a PULINENO value, but was subsequently removed due to not satisfying the necessary conditions to be included in the household roster. Without more information from the BLS or the Census Bureau however, I cannot confirm whether this is the case.
Note that the BLS provides detailed information regarding CPS response rates on the CPS methods website.
2025-05-12 · CPS · marked as solution
As you suggest, the discrepancy between the Census Bureau’s and the Bureau of Labor Statistics’ (BLS) conversation rates is driven by their different methods.
The technical report preceding the Census crosswalk in this working paper (Scopp, 2003) explains that “the crosswalks presented in this paper attempt to merge the best of both methods”, the methods being: (a) examining occupation/industry titles for “ideal” changes, and (b) individually double coding a sample of respondents into both the 1990 and 2000 industry and occupation classifications.
The Census crosswalks start from a list of “legitimate 1990-2000 code combinations” based on their appearance in the index title crosswalk. Census Bureau researchers then re-coded a sample of respondents from the 1990 census to the 2000 census codes using the provided description of the respondent’s job (or if unemployed, their most recent job held in the 5 years prior to the Census). Note that no double surveying of respondents occurred; the codes were allocated logically based on a review of the job description. The percent of each reported code combination in the double coded sample then drove the conversion factors within the allowable combinations. Some additional combinations not in the index that were later deemed legitimate were re-added, but double coded combinations that were deemed the result of coding error were eliminated.
The method used in the BLS conversion factor tables that you link to is briefly summarized in a note preceding the tables. It states that the factors “are based on 3-year average survey microdata (2000-2002) that were dual-coded” and that the tables report “the percent distribution of employment re-coded from one classification system to another.” Moreover, the BLS states that the “conversion factors incorporate classifications that were allocated or, on occasion, mis-assigned.” There is no suggestion that double-coded conversation rates were restricted to a matrix of legitimate values as in the Census Bureau’s crosswalk. The cautionary note regarding misassignment further suggests that cases were not discarded based on suspected miscoding. This likely drives the larger number of cross-walked occupation code combinations in the BLS crosswalk.
We do not have a digitized version of these BLS crosswalks. However, you may try reaching out to the BLS directly to see if they may have this data and can share it.
2025-05-09 · CPS
Thank you for your patience. We are looking into your question and will share more information next week.
2025-05-09 · USA
While form 2 was administered to 15% of the population, the IPUMS form 2 state sample only includes records for 1% of the US population (the same as the other 1970 samples). The decision of which form to use depends on the variables that you require since each form contains variables that are not available in the other.
Without seeing your exact estimates, I’m unsure of how substantially your estimates differ. However, given the large number of industries identified in the data and the relatively small sampling density, I’m not surprised that sampling error could result in significant differences in your estimates. If individual-level microdata is not essential for your research, then I recommend taking a look at the geographically aggregated summary statistics on our spatial data project, IPUMS NHGIS. The project distributes published summary data tables from decennial censuses that are derived from the Census Bureau’s full count file. By filtering to 1970 (year) and occupation and industry (topics) in the data finder tool, you should be able to find table NT62A which provides counts of the population across 41 industries by state (as well as many smaller areas). We recommend that new users familiarize themselves with the website by viewing the short video tutorials on our user guide as well as relevant portions of the FAQ page.
2025-05-08 · General
Let me answer your questions by going through the universe statements for FSSTMPDAY chronologically. To preface, all of the universe definitions for this variable are backwards-looking; they never restrict respondents based on current SNAP enrollment status or expectations for future benefits. I obtained these universe definitions by reviewing the corresponding Food Security Supplement codebook. The variable that reports the date that benefits were received is alternatively coded as either HESP2D (1998-onwards) or as HES9AD.
1995-1996:
- Someone in the household must have received benefits within the past 30 days from the interview date, and
- The household’s income must have been below 185% of the poverty threshold.
1997-1998:
- Someone in the household must have received benefits during either the interview month or one of the two previous months, and
- The household’s income must have been below 185% of the poverty threshold.
While from 1997-1998 there is also a requirement that someone is the household have received benefits with the 12 months prior to the interview date, this criteria is already captured by the requirement to have received benefits within the previous two months. Households that received benefits more than two months previous to the interview, even if it was less than 12 months, would not be in universe for this question.
1999-2001:
- Someone in the household must have received benefits during either the interview month or one of the two previous months, and
- The household’s income must have been below 185% of the poverty threshold, or
- Someone in the household received WIC during the previous 30 days (in 2000).
- Reported that the household in the past 12 months “ever ran short of money and tried to make food or food money go further” (in 2001).
In 1999-2001, there is no requirement to have received the benefits in both the current and previous calendar month (just one is sufficient).
2002-2011:
- Someone in the household must have received benefits in November, and
- Benefits were not (or not yet) received in December, and
- The household’s income must have been below 185% of the poverty threshold, or
- Reported that the household in the past 12 months “ever ran short of money and tried to make food or food money go further” .
In 2002-2011, this identifies households that either exited the SNAP program in November and did not receive (or do not expect to receive) benefits in December, or are currently enrolled and have not yet received their December benefits. The purpose of this question appears to be to gauge the number of days the household went without SNAP benefits, not to obtain the date that households typically receive SNAP benefits. As stated, there is no variable that identifies current enrollment in SNAP in the data.
Since benefits are typically received on the same day each month, you might be able to separate these two groups by observing the reported date of November benefits. Note that the CPS interview week typically falls on the week containing the 19th of each month. Households that received benefits in November are separated identified in FSSTMPNOV.
2025-05-07 · CPS
FAMREL states the person’s relationship to their Census-defined subfamily unit in FTYPE. There are five defined subfamily unit types:
- Primary family - A married couple with or without children, or one parent with one or more own never married children under 18 years old, who maintain the household.
- Related subfamily - A married couple with or without children, or one parent with one or more own never married children under 18 years old, living in a household and related to, but not including, the person or couple who maintains the household.
- Unrelated subfamily - A married couple with or without children, or a single parent with one or more own never-married children under 18 years old living in a household. Unrelated subfamily members are not related to the householder.
- Nonfamily householder - A householder living alone or where the householder shares the home exclusively with people to whom he/she is not related.
- Secondary individual - People who reside in a household, but are not related to the householder and are not unrelated subfamily members.
Following these definitions, unmarried partners are never matched into the same subfamily. If neither unmarried partners have children, they will coded as either nonfamily householders or as secondary individuals. All persons with these family types are then assigned a FAMREL value of 0 (“Not a Family Member”). If one of the unmarried partners has children, the one who is assigned as the family reference person (FAMREL = 1) will be coded as belonging to the primary family or to one of the subfamily units. Their partner will then be coded as either a nonfamily householder or as a secondary individual. The ‘spouse’ indicator in FAMREL can only refer to the married spouse of a family reference person in either the primary family or in a (un)related subfamily.
This Census Bureau Discussion Paper describes the original work to define SPM resource sharing units in 2007 when the Census Bureau began asking unmarried respondents in households with unrelated adults: “Do you have a boyfriend, girlfriend or partner in this household?” If they responded yes, the respondent was then asked to identify the cohabiting partner and the interviewer recorded the partner’s line number. This is recorded in the variable PECOHAB and reports the cohabiting partner’s LINENO value (note that this is not their PERNUM value, which is what the IPUMS family interrelationships variables such as SPLOC report). I would recommend using this self-reported cohabitor identifier in your work along with the self-reported identifier for a person’s spouse (ASPOUSE).
2025-05-06 · General
In order to replicate BLS topside labor force estimates, observations should be weighted using the composite weight COMPWT. When I apply this weight in the IPUMS CPS BMS online analysis tool (see screenshot of input fields below), I find that 3.8% of the labor force in March 2025 were unemployed experienced workers (i.e., people who had been previously employed) and 0.4% were unemployed new workers, totaling the 4.2% figure in the official data.
For more information, I recommend reviewing our blog post on replicating alternative measures of unemployment in the CPS.
2025-04-28 · USA
We hope to have the revised data up during this week.
2025-04-25 · USA
Thank you for your message. We are aware of this issue that affects MIGCOUNTY1 and PWCOUNTY in the 2023 5-year sample. We are working on adding this data and plan to have it available for download soon. Once the fix has been noted on our revision history page, please resubmit your extract to download the new data.
2025-04-25 · General
The 2009 Design and Methodology report describes this period (2000-2004) as a “demonstration stage”:
During the demonstration stage (2000 to 2004), the Census Bureau carried out large-scale, nationwide surveys and produced reports for the nation, the states, and large geographic areas. The full implementation stage began in January 2005, with an annual HU sample of approximately 3 million addresses throughout the United States and 36,000 addresses in Puerto Rico. And in 2006, approximately 20,000 group quarters were added to the ACS so that the data fully describe the characteristics of the population residing in geographic areas.
More specifically regarding sampling in 2002, this report on the operational feasibility of the ACS makes the following note:
The workloads shown for the 2002 ACS dropped somewhat from 2001 levels because of a planned decrease in the sample within the ACS test sites and an additional adjustment to the Supplementary Survey sample…The ACS test sites were originally sampled at a high rate that allowed three-year averages to be compared to the Census 2000 at the tract and county level. Starting in 2002 the sample size in the ACS test sites is at the level required for five-year averages. Budgetary constraints required an additional cut to the sample of the 2002 Supplementary Survey. The entire July panel was dropped, plus the CATI and CAPI nonresponse followups were dropped from the June panel.
Due to significant differences between the demonstration stage and full implementation, especially the absence of group quarters individuals, particular caution should be used with estimates from this early period of the ACS.
2025-04-23 · IPUMS API
You are correct that the read_ipums_ddi() function only takes an .xml input. This function is meant to ingest the DDI codebook, which is available for download on your extract page as an .xml file.
The instructions under the heading Getting the data into your statistics software package from the exercise you link to notes that you should download both the data file (in .dat format) and the DDI codebook (in .xml format). To download the DDI codebook, right click on the DDI link to the right of the corresponding data extract and choose “Save link as…”. You can then select the codebook to be saved as an .xml file by selecting this option next to “Save as type”. Save both the .dat and .xml files to the same folder. The read_ipums_ddi() function should then use the .xml codebook while the read_ipums_micro() will load the corresponding .dat file with the same name as the codebook.
ddi ← read_ipums_ddi(“nhis_#####.xml”)
Note: Replace ##### with your extract number (e.g. 00001).
data ← read_ipums_micro(ddi)
2025-04-23 · IPUMS API
Once you’ve obtained your API key, you should store it in an environment variable. See these instructions for saving environment variables in conda environments for different operating systems. The sample code provided on our Getting Started with ipumspy page assumes that the API key is stored in an environment variable called IPUMS_API_KEY. Running the sample code without doing this will result in an error. You can alternatively directly input your API key by replacing
IPUMS_API_KEY = os.environ.get(“IPUMS_API_KEY”)
with
IPUMS_API_KEY = “REPLACE_WITH_YOUR_ACTUAL_KEY”
2025-04-23 · USA
BPL is a harmonized variable created by IPUMS that facilitates analyses of places of birth that are consistent across samples despite changes in codes in the source data that may reflect shifting political boundaries and differing degrees of detail. This can sometimes result in coding that is consistent, but a bit tricky to interpret. We offer the original coding for birthplace used to assign codes in BPL in sample-specific source variables (e.g., US1990B_POB, US1980B_BIRTHPL). You might consider adding source variables to your data extract and cross tabulating them with BPL(D) in order to get a better sense of how birthplaces were harmonized. The specific case that you have asked about reflects the complexity of capturing this measure over time amidst changing political boundaries; I will address the specific codes you mentioned and briefly describe how they fit together.
The basis for the coding structure of these specific codes reflects that the Russian SFSR, though the most populous constituent part of the USSR, is separately identified as a birthplace in the Census microdata for the first time in 1980 (as opposed to Ukraine, Belarus, or the Baltics); it is NOT identified in 1990, but Russia is identified in 2000-onwards.
-
BPLD = 46500 (“Other USSR/Russia”) identifies respondents who reported being born in Russia, the Russian SFSR, or – based on their reported birthplace – were most likely born there (“Other USSR”).
- Because those born in the Russian SFSR were not directly identified until 1980, the majority of persons who are coded as being born in the USSR, but not in one of the other identified republics, were born in the Russian SFSR. IPUMS therefore codes any responses of the Soviet Union as a birthplace (with no additional specification) to this code for samples collected during the Soviet Union’s existence (1920-1990). The only exception is in 1980, as explained below.
-
BPLD = 46590 (“USSR, n.s./n.e.c.”) identifies respondents who reported being born in the Soviet Union and not in Russia or the Russian SFSR.
- This is only possible in samples where Russia or the Russian SFSR is identified as a separate birthplace from the Soviet Union (1980, 2000-onwards).
1980 is the only year during the Soviet Union’s existence where persons could be coded as being born in the Russian SFSR or the Soviet Union (or another constituent part of the USSR). However, I’m surprised to see how few cases are assigned BPLD = 46500 (“Other USSR/Russia”) as opposed to BPLD = 46590 (“USSR, n.s./n.e.c.”) in this sample. I will share a note with my colleagues to see if it may make sense to recode persons who reported their birthplace as “USSR n.e.c.” in this sample to BPLD = 46500 (“Other USSR/Russia”).
2025-04-22 · International
The documentation for the Phase 2 Burkina Faso survey states that “the female questionnaire is used to collect information from all women aged 15 to 49 who were listed on the household roster at selected households.” This includes women who were not usual residents of the household. I found no indication that questions relating to intimate partner violence were only administered to a single, randomly-selected woman in the household. I was able to locate households where multiple women have data recorded for these variables (e.g., IPVEMOYR).
However, not all eligible women in the household are asked questions regarding IPV. Details on who is asked a particular question, and is therefore in-universe for the corresponding variable, is found in the variable’s universe tab. For instance, the universe tab for IPVEMOYR notes that the corresponding question is only asked of “women aged 15-49 who were able to be interviewed under complete privacy and who are currently married or living together with a man” (i.e., MARSTAT = 21 or 22). Therefore, respondents to the female questionnaire who do not meet these criteria are not-in-universe (NIU) for IPVEMOYR and are assigned the NIU code (99) for this variable. These qualifications may limit the number of households where multiple women are eligible to respond to a particular question. Note that because your previous question is about the Phase 2 data from Burkina Faso, I only checked the documentation for this sample. It is possible that other samples may have different criteria for responding to IPV questions; the universe tab is a good place to look for this type of information.
2025-04-17 · International
This PMA webpage for the Burkina Faso Phase 2 survey provides the following information regarding the household questionnaire:
The household questionnaire gathers basic information about the household, such as ownership of livestock and durable goods, as well as characteristics of the dwelling unit, including wall, floor and roof materials, water sources, and sanitation facilities. This information is used to construct a wealth quintile index. The first section of the household questionnaire, the household roster, lists basic demographic information about all usual members of the household and visitors who stayed with the household the night before the interview. This roster is used to identify eligible respondents for the female questionnaire.
The household questionnaire therefore only asks about the sampled household. Visitors who stayed with the household the night before the interview are included in the household roster, but the only household data associated with them is that of the sampled household that they were a visitor of.
2025-04-16 · International
HHID provides a unique within-sample household identification number; it cannot be used to identify the same household across the panel (see HHIDORIGP1 for a longitudinal household identifier). You can use LINENO (household member’s line number within the household) to filter to a single record per household. You can find these variables from the Family Planning - Person unit of analysis variable selection tool by clicking the Topics → Technical → Technical Variables drop down menu.
As you note, restricting to a single observation per household is required to avoid double-counting households with more than one person when estimating household-level statistics (e.g., the percent of households whose main source of drinking water is piped into their dwelling). You will also need to weight your household data using HQWEIGHT to produce representative estimates. For person-level statistics (e.g., the percent of women who have ever given birth), there is no need to restrict to one observation per household because the analysis weight FQWEIGHT addresses these selection probabilities.
2025-04-15 · CPS
While I cannot provide code review of your analysis, I can provide some conceptual feedback and guidance.
Note that the CPS is most often used to produce monthly labor market estimates and may not match income data reported using other data sources. This is especially true of estimates for substate areas (i.e., large metropolitan areas, metropolitan divisions, and principal cities), which the Census Bureau has characterized as having a high degree of sampling error due to the unavailability of independent population controls and a lack of demographic coverage. The Census Bureau notes that data users may be better served by substate area data from the annual American Community Survey — see IPUMS USA for microdata and IPUMS NHGIS for geographically aggregated summary statistics from the ACS.
I reviewed your recent data extract and observed that you’ve included a few different income variables: EARNWEEK2 and FAMINC, which are available in the monthly samples, and ADJGINC, which is only available annually in the Annual Social and Economic Supplement (ASEC). Because you have indicated you are interested in monthly estimates, I am only sharing details about EARNWEEK2 and FAMINC.
-
FAMINC is a monthly variable that reports the (intervalled) income of all members of the householder’s family; this value is assigned to all persons in the household (including those who are not part of the householder’s family). To obtain household-level estimates using FAMINC, it is necessary to restrict analysis to a single individual in each household (typically to those with PERNUM = 1) and weight observations using HWTFINL.
-
EARNWEEK2 is a monthly variable in the outgoing rotation group (ORG) questions that is asked of all respondents in their fourth and eighth month-in-sample (MISH). It reports a rounded value for the respondent’s weekly salary/wage income. As noted in this variable’s universe tab, it excludes self-employed persons (identified in CLASSWKR). Additionally, it only reports wage/salary income earned at the respondent’s current job (i.e., it does not include all other types of income such as income from interest, rents, disability, etc). EARNWEEK2 is a person -level variable in the ORG questions, it should be weighted using the person-level weight EARNWT.
If you are interested in capturing monthly family income, FAMINC is most appropriate. However, if you are interested in person-level income, EARNWEEK2 may be preferable. If you are interested in annual income instead of monthly income, I recommend exploring FTOTVAL as well as ADJINC; the former includes all income earned by family members while the latter excludes non-taxable income.
2025-04-11 · Higher Ed
While IPUMS Higher Ed provides data from three surveys — the National Survey of College Graduates (NSCG), the National Survey of Recent College Graduates (NSRCG), and the Survey of Doctorate Recipients (SDR) — we only release the SESTAT (Scientists and Engineers Statistical Data System) subsamples of the NSCG and the NSRCG. This subsample consists of fewer respondents, including only those with science or engineering degrees or occupations, and also includes fewer variables. For example, MRRGN is available only as a restricted use variable in the NSCG SESTAT sample.
You can merge respondents from an IPUMS Higher Ed data extract with the full NSCG file containing MRRGN and any other variables of interest (see the public use files page) using REFID.
2025-04-10 · IPUMS API
I’m glad that we were able to connect and troubleshoot the issue with your code. I’m sharing the resources that I mentioned in our conversation to help those using Python to submit their API calls better navigate this issue.
We provide a language-specific library in the form of ipumspy that allows Python users to simplify their API calls. Our Getting Started guide to ipumspy begins by explaining how to initialize an API client using your API key before discussing how to create an extract definition. While discussing how to get an API key, the guide notes that we recommend storing your key in an environment variable in order to prevent it from being shared. The example code on the page therefore assumes that the API key is stored in an environment variable called IPUMS_API_KEY. If you have done so, then the IPUMS_API_KEY in:
IPUMS_API_KEY = os.environ.get(“IPUMS_API_KEY”)
will be the string “IPUMS_API_KEY” that is saved as an environmental variable, not to be replaced with your actual key. If you decide not to hard-code your key, then this line can be replaced with:
IPUMS_API_KEY = “REPLACE-WITH-YOUR-KEY”
We encourage ipumspy users who have reviewed our documentation and who are still having trouble to share their code so that we can help better troubleshoot their issue.
2025-04-04 · CPS
Thank you for bringing this to our attention. I agree that this is confusing; while the label for ACTSAME (“Still have the same work activities”) provides the correct interpretation of the data, the information in the description tab that you cite is unclear.
The original question associated with ACTSAME (PUIODP2 in the PUMS codebook) is “Have the usual activities and duties of your job changed since last month?” In the harmonization process, we swap “Yes” and “No” responses to this question to create ACTSAME so that it reports whether a respondent still had the same work activities. Respondents who answered “Yes” to having a change in their activities/duties in the original question are coded as “No” in ACTSAME and vice-versa. I have a note out to my colleagues to look into improving this documentation.
2025-04-04 · USA · marked as solution
There are a number of differences between the CPS and ACS that result in expected discrepancies in estimates for poverty rates between the two surveys. These include differences in misreporting of income by respondents across surveys (see this working paper by Rothbaum), differences in reference periods for income (ACS asks about income in the past 12 month, while the ASEC asks about the previous calendar year), and the lack of questions regarding taxes in the ACS (see Fox, Glassman, and Pacas) for SPM calculations, among others. Additional differences are summarized in this fact sheet comparing ACS and the CPS ASEC. Considering these significant differences between the surveys, the discrepancy that you are noting is relatively small. For comparison, the reported margin of error for poverty estimates in the 2023 ASEC is 0.3 percentage points, which is without considering the differences in methods that the ACS introduces.
To replicate official poverty statistics, the Poverty in the United States report “recommends that people use the CPS ASEC for timely and thorough estimates of national poverty”, but that the ACS “can be used for subnational poverty estimates” due to its larger sample size. The Census Bureau presents annual estimates of poverty by state and other smaller geographic units based on data collected in the ACS. Single-year estimates from the ACS are available for geographic units with populations of 65,000 or more. Estimates of income and poverty for all geographic units, including census tracts and block groups, are available by pooling 5 years of ACS data. We provide ACS summary tables of poverty for states and other smaller geographic areas on IPUMS NHGIS.
In order to use the microdata on IPUMS CPS to replicate national estimates, you should run the following specification in SDA:
IPUMS CPS:
Row = offpov
Weight = sdawt
Filter = year(2016), race(200), offpov(1-2)
While SPMPOV, which you used in the screenshots you shared, reports poverty status using the supplemental poverty measure, OFFPOV provides the official poverty status that is used in the report. Additionally, the report uses the 2016 ASEC to estimate poverty for 2015 since income questions in the survey reference the preceding calendar year. When I do this, I am able to exactly replicate the report’s estimate of 24.1%.
If you plan to use IPUMS USA ACS data to match published state-level poverty estimates within the margin of error, you should run the following specification in SDA:
IPUMS USA:
Row = statefip
Column = cbpoverty(r:1-99; 100-501)
Weight = perwt
Filter = year(2016), race(2), gq(0-2,5), cbpoverty(1-501)
CBPOVERTY uses the Census Bureau’s family definitions to report each person’s total family income expressed as a percentage of the poverty threshold for their specific family situation. It is provided so that users can replicate published Census Bureau poverty estimates. You should also include respondents in GQ = 5 in your analysis.
2025-04-04 · International
The variable RESIDENT is available in the Burkina Faso 2021 Phase 2 Family Planning unit of analysis. You can add this variable by selecting Person → Family Planning as your unit of analysis in the variable selection menu.
2025-04-02 · CPS
IPUMS CPS does not provide this data as a harmonized variable. However, it is available in the unharmonized variable UH_EIPCRD_A1. Unharmonized variables provide the original data released by the Census Bureau and have not been edited by IPUMS for comparability across samples.
You can access unharmonized variables through either the drop-down menus on the variable selection page by filling in the corresponding (“unharmonized variables”) bubble, or by searching using keywords in our variable search tool and including unharmonized variables under variable type.
2025-04-02 · General
We provide three different samples from the 1850 census slave schedules. Generally, once a slaveholding is selected for sampling, information on all enslaved persons within a selected holding is provided. The only exception is in the case of slaveholdings with 100 or more slaves in the urban/group quarters sample. I summarize some of the key information for each sample below; additional information is available on our user guide. We currently only provide this data as a .dat fixed-width file with command files to import the data into Stata, SAS, and SPSS. However, if you email us at ipums@umn.edu and request a specific sample, I should be able to share a .CSV Excel file of the data with you.
1850 Flat Sample
This sample contains approximately 1-in-20 sample of the slaves enumerated in 1850. To ensure that holdings had an equal probability of being included in the sample regardless of their size, a holding was entered only if a sample point (a randomly generated window of four consecutive lines on each 84 line page) fell on the line containing the holding’s first slave. When the sample point fell on any other line, the holding was skipped. If the holding was included, all slaves were entered.
1850 Urban/Group Quarters Sample
For most of the slaveholding United States, this sample is also an approximately 1-in-20 sample. Also included, however, is an oversample of cases from the counties that contained the South’s ten largest cities – Baltimore, Maryland, New Orleans, Louisiana, St. Louis, Missouri, Louisville, Kentucky, Charleston, South Carolina, Washington, DC, Richmond, Virginia, Mobile, Alabama, Savannah, Georgia, and Norfolk, Virginia. In these ten counties, the sampling rate is 1-in-4. While the same sampling rule from the flat sample is used for slaveholders with less than 100 slaves, if the sampling window fell within a slaveholding with 100 or more slaves, data would be recorded for all the slaves within the sampling window and regardless of whether anyone in the window was the holding’s first slave. This increases representation of large holdings.
1850 Linked Slave/Free Population Sample
This dataset is a 1-in-100 sample of the slave and free population in 1850 following a similar sample design to the one used in the 1850 flat sample . The dataset contains all persons present in the original 1850 IPUMS sample, regardless of whether or not they were slaveholders. For all free persons, there are variables identifying serial and person number in the original 1850 IPUMS data as well as slaveholder status. For all slave persons, there are variables indicating serial number of the slaveholding household in which they lived, location of the slaveholding on the slave schedules, and age, race, and sex of the slave. Using SERIAL and PERNUM, this data can easily be integrated with the 1850 Free Population data available at the IPUMS-USA website.
2025-04-02 · CPS
Since the NHIS uses a broader occupation (OCC) classification system, you will need a crosswalk that maps the detailed CPS occupation codes into their correct NHIS code.
These crosswalks appear in the appendices to the NHIS sample adult codebooks. The 2020 NHIS codebook (the first year to code occupations based on the 2018 Census Bureau system) provides this crosswalk on page 621. You can additionally find the 2010 vintage crosswalk (for recoding occupations in samples from 2010-2018) in the 2010 NHIS sample adult codebook.
2025-04-01 · USA · marked as solution
When selecting samples to analyze online, we note that the “U.S. file includes the single-year ACS samples and 1% versions of each decennial census, including the 1970 Form 1 metro sample.” Upon review, this appears to be incorrect; the USA 1850-2023 sample defaults to the Form 2 metro sample for 1970. Thank you for bringing this to our attention with your question.
You should find that the data match when comparing your online tabulation with the 1970 1% fm2 metro data. While you may combine multiple 1970 samples together (such as both metro samples) for analysis in your stats package, you should be aware that there are a number of questions that appear on one form but not the other. Additionally, since the person-level weight PERWT sums to the total US population within each sample, combining multiple samples from the same year causes PERWT to sum to multiples of the total population. For this reason, it’s necessary to divide all values of PERWT by the total number of samples from the same year in your analysis (e.g., divide by two if including both 1970 metro samples).
2025-03-28 · General
The ACS has never asked respondents to provide their parents’ place of birth. Since respondents report their own place of birth, IPUMS, by identifying and linking parents with their co-resident children, is able to offer the characteristics of participants’ parents as additional variables using the attach characteristics tool. In the case of mother’s and father’s place of birth, the variables that are created in this process are BPL_MOM and BPL_POP. These are not available for selection as regular variables; you will first need to add BPL to your data cart. Once you’ve done this and continued to the extract request options menu, you will see a button to Attach Characteristics (see screenshot below). When you click this, you should see the option to attach BPL values for the household head, mother, father, and spouse.
As I mentioned previously, it is only possible to obtain a respondent’s mother’s/father’s BPL value in cases where we are able to identify their mother/father from among the person records within the household. If we do not identify mother/father in the household, then BPL_MOM/BPL_POP will be missing. As a result, this is not an appropriate method for measuring parental birthplace at a population level. More information about this procedure is provided in the linking variables MOMLOC and POPLOC.
2025-03-27 · NHGIS
This Census Bureau chapter helps explain the history and construction of Census blocks and block groups. It’s important to be aware that in the 1960 census, the Census Bureau reported block statistics for only 295 cities with a population of 50,000 or more. The only city in Northampton County that passed this threshold was Bethlehem; you can find block statistics for the city in this census publication. In 1970, block group statistics are available for urban areas, including the Allentown-Bethlehem-Easton Standard Metropolitan Statistical Area (SMSA). For 1980, the census block program expanded to include, in addition to urbanized areas, all incorporated places of 10,000 or greater population. You should be aware that since blocks are routinely split and new blocks are created, a block in one year does not necessarily refer to the same area as a block with the same code in a different year.
IPUMS NHGIS does not provide any shapefiles for 1960 block boundaries. Our 1970 block boundary shapefiles include all or part of 21 metropolitan areas and our 1980 block boundary shapefiles include all or part of 148 metropolitan areas; however, neither of these currently cover any areas within Northampton County. The challenge lies in the fact that while the U.S. Census Bureau’s 1992 TIGER/Line Files include both 1990 and 1980 census block boundaries, the 1980 blocks are badly incomplete and often inaccurate. We will keep working to extend the files to include more areas in future releases.
2025-03-26 · CPS
I can confirm that I’m seeing this same small discrepancy in labor force estimates when using WTFINL, but I was unable to determine the source of this discrepancy. I checked that we have correctly coded respondents based on the data provided in the Census Bureau Public Use Microdata Sample (PUMS) and that the data matches the monthly files shared by the NBER. Moreover, the 1995 CPS ASEC codebook states that “for all CPS data files a single weight is prepared and used to compute the monthly labor force status estimates.” Based on this documentation, I would expect you to be able to replicate these estimates using WTFINL. The two-step composite estimation method for COMPWT was introduced in January 1998, which is why this weight is not available for earlier samples.
It is possible that the FRED estimates are derived from a different version of the microdata or they recode labor force participation using a different definition than the one presented in the PUMS. However, without more knowledge of the methodology from the linked FRED data, it’s difficult to tell what the cause of this discrepancy might be. This annual time series from FRED provides a detailed definition of the employed and unemployed population. You might compare the definition used there with the original ASEC codebook to note any potential discrepancies. You can also explore the original versions of the employment/labor force variables that we make available as unharmonized variables. These can be found using the search tool by checking the “include unharmonized variables” option or by using the drop-down menu in the variable selection screen after filling the unharmonized variables bubble. Some of the relevant variables include UH_MLR_B3 (monthly labor force recode), UH_ANYWK_B2 (any work at all last week), UH_LK_B1 (look for work last 4 weeks), UH_LAYOFF_B1 (on layoff last week), and UH_LKAVR_B1 (reason could not start a job last week if offered one).
2025-03-26 · USA
The Census Bureau aggregates nurse midwives together with nurse practitioners in the OCCSOC code “2911XX” in the ACS public use microdata (for reference, see the OCCSOC crosswalk). To your question, we do not offer the option to download data for a specific OCCSOC code with the select cases tool.
2025-03-26 · Health Surveys · marked as solution
Information on medical conditions in the MEPS is only reported if the condition is linked to a reported medical event or prescribed medicine during the calendar year. While there are some inpatient, outpatient, and ER events in the MEPS, the majority of reported medical events in the household survey data are either office-based medical provider visits (EVENTYPEJ = 1) or prescribed medicines (EVENTYPEJ = 8). For example, the 2022 MEPS only contains 2,433 records of hospital in-patient stays, compared with 159,729 office-based visits and 116,727 prescribed medicines. This significantly contrasts with the administrative data in HCUP, which has a strong emphasis on hospital usage.
While there are more reported inpatient stays for CCSR1 = END002 than for END003 (10 versus 0 in the 2022 MEPS), this is a relatively small sample size and may not be particularly informative of overall cases. If you’re looking to focus on these types of hospital-related medical events, the administrative data in HCUP will likely provide much greater precision.
2025-03-25 · USA
Thank you for letting us know about your interest in the TAXSIM variables. IPUMS does not create these variables; we integrate them into the IPUMS USA database from the Census Bureau Supplemental Poverty Measure (SPM) data files (released separately from the rest of the ACS). Currently, we only offer the 2009-2019 data, but we plan to include the recently released 2021-2022 SPM data for ACS in the future.
Note that the ACS does not collect any information on a household’s tax obligations or tax filing. Instead, the Census Bureau uses the NBER’s TAXSIM program to create these variables. There are several issues which make running TAXSIM using ACS data challenging (addressed on page 9 of Fox, Glassman, and Pacas):
- Tax filing units need to be formed. This is challenging in the ACS due to the minimal relationship data available in the survey. Using relationship criteria developed by IPUMS, parental and spousal identifiers were created in order to identify the detailed familial relationships needed to form tax units (e.g., FAMUNIT and SUBFAM).
- There is no information in the ACS about whether or not the respondent filed taxes.
- There are a number of income variables that TAXSIM asks for which are not available in the ACS (including mortgage deductions and unemployment income).
I will also note that the Current Population Survey’s Annual Social and Economic Supplement (CPS ASEC; accessible using IPUMS CPS) reports SPM variables each year and that the CPS is the recommended source for national poverty estimates. We are collaborating with Columbia’s Center on Poverty and Social Policy to make historical SPM variables available in the CPS prior to 2009. Without more information on your interest in these variables, I am not sure if the CPS is a suitable substitute for the ACS variables in your use case.
2025-03-20 · CPS
Following CPS Technical Paper 77 (chapter 2-4), we typically recommend using replicate weights to estimate variances with CPS microdata (see our detailed CPS replicate weight user guide). However, replicate weights are only available for CPS supplements and are not provided for monthly BMS data. Since you reference borrowing GVF factors for variance estimation, I assume that you have reviewed the BLS instructions for calculating standard errors and confidence intervals. This guide states that “when considering multiple series to borrow from, using the 𝛼 and 𝛽 parameters that generate the highest standard error is generally advised”, though I understand that having standard errors that are 30-50 times larger than the estimates may not be particularly helpful.
While the PSU and strata sample design parameters are not released publicly, Davern et al. (2007) showed that specifying the lowest level of identifiable geography (sequentially as INDIVIDCC, COUNTY, METFIPS, and STATEFIP) as the strata, and household SERIAL (only unique to each household in a given survey month and year) as the cluster, performed reasonably well at estimating standard errors when compared to using the internal sample design data.
2025-03-19 · CPS
Thanks for your patience and bringing this to our attention. It appears that different file types of the original Census Bureau 2024 CPS ASEC PUMS data have different values for this variable. Specifically, the ASCII file downloaded via FTP seems to truncate the variable and only display the first three digits, though it does not appear in either the CSV file via FTP download or data files requested via the API. This may be related to the variable STTAXREB being removed between the 2023 and 2024 ASEC, though I cannot say without confirmation from the Census Bureau. Since IPUMS CPS ingests the ASCII file for our harmonized data, it is not surprising that this issue is present in our data.
I have shared this with the IPUMS CPS team who will review and see if it is possible to provide data for this variable from other sources. In the meantime, you can merge observations with untruncated TAX_ID values with your IPUMS CPS extract using the linking keys HRHHID, HRHHID2, and LINENO (referred to as PULINENO in the CB data).
2025-03-18 · General
Our spatial project, IPUMS NHGIS, has aggregate summary tables at the census tract level for all of the years that you’ve mentioned. This includes place-of-birth tables from 1960-2000 and ancestry from 1980-2000. For 1980 and 1990, place-of-birth tables aren’t available for entire tracts, but only for a “compound level” that includes intersections between tracts and different county subdivisions (see this FAQ for more detail). Ancestry tables are available for whole tracts in 1980 & 1990, and for place-of-birth tables in 1970. You can refer to the screenshot below for the appropriate filter in the data finder tool.
PUMAs were created as part of the 1990 decennial census and are therefore not available for prior years. In the IPUMS USA microdata, the smallest geographic unit identified for all respondents in 1970 (metro samples) and 1980 is the county group (CNTYGP97 and CNTYGP98). While 1970 county groups do not provide any sub-county detail, 1980 county groups do subdivide some larger counties. Note that the counties identified in COUNTYFIP and COUNTYICP for these samples are based on county group data and do not identify any additional counties.
2025-03-18 · CPS
This type of imputation is not a topic that I’m familiar with and I’m not aware of any methods currently in use. If you pursue the IPF algorithm you suggest, I encourage you to review the ASEC variables for the 1962-1967 samples (those without children under 14) to identify which concepts are most important. These might include marital status (MARST), the presence of children in the household aged 14+, or variables that may capture childcare demands (e.g., MAJORACT or WHYPTLWK). Note that IPUMS CPS does not have any data from years prior to 1962.
Depending on your research question, you may be interested in using decennial census data from IPUMS USA. While you lose the temporal precision of the annual CPS data, there is a significant overlap in the topical coverage. This includes employment and earnings data in the IPUMS USA variables EMPSTAT (employment status), INCWAGE (wage income), and FTOTINC (total family income). I will also note that we have annual county-level natality data available through IPUMS NHGIS, which may help you address the decreased temporal precision in the decennial data.
Regarding data quality flags, IPUMS CPS provides these data quality indicators as variable flags. You can view each variable’s associated flag by opening the Flags tab on the associated variable’s documentation page (e.g., INCWAGE) and clicking on the link. Since most flag variables start with the letter Q, a way to search for all of them is to use the alphabetical drop-down menu from the variable selection menu and look at all Q variables. Flags can also be added in bulk from the extract request page by clicking the Select Data Quality Flags button. Note that flags are not available for all variables and may be available only in certain samples for other variables.
2025-03-18 · International
Thank you for bringing this to our attention. It appears that we used the incorrect variable to code observations for IND in the 2017 Mozambique sample. The IPUMS-International team plans to implement a fix in the next week or two that will reassign data from the source variable MZ2017A_0470 to IND. The link in the codes tab will also be edited to point to this source variable. In reviewing other recently released samples, it was also determined that a similar error was included in the IND data for the Mongolia 2010 sample. Data from the source variable MN2010A_0436 will instead be used for this sample.
We really appreciate your recent posts that have alerted us to these issues and helped us improve the data for all. We like to offer an IPUMS branded mug as a token of gratitude for our users who make these types of contributions. Please reach out to us at ipums@umn.edu with an address that we can ship your mug to.
2025-03-18 · CPS
As I mentioned in this post, this sounds like an ideal application of our API, which allows researchers to share R code with the specifications for a data extract (samples, variables, and other options) that other users can run themselves to download and input the data directly in R. Our ipumsr documentation website provides a vignette with sample code for submitting API data requests using the ipumsr package. We know that broader (i.e., non-API-based) functionality to share extracts with others would be of interest to IPUMS data users, but do not offer this functionality beyond sharing API calls at this time.
2025-03-14 · CPS
Thank you for bringing this to our attention. I have replicated the issue that you’re seeing in the data and am investigating further. I will follow up next week as soon as I have more information to share.
2025-03-14 · International
Thank you for bringing this to our attention and for your patience while I looked into your question.
IPUMS International recently applied additional universe standardization to our migration variables (see this user guide for details). Previously, some migration variables reported information on both recent movers and non-movers regarding their location of residence a certain number of years in the past, while other samples only collected this information from recent movers. Many of these variables are now standardized such that data is reported for all persons; non-movers are assigned their current location of residence. This is the case for the general migration variable GEOMIG1_P and the Brazil-specific variable MIG1_P_BR, which explains why you are seeing values of states of previous residence for those who report not having moved municipalities within the past ten years.
However, while the universe statement for MIG1_P_BR was edited to read “all persons”, we missed editing the corresponding universe statement for GEOMIG1_P. The IPUMS International team is aware of this and will fix the documentation such that the universe statement for GEOMIG1_P for Brazil samples will read “all persons”. I hope this clarifies how you can best proceed with analyzing the data. Please note also that “non-movers” can still be identified using the unharmonized source variables (BR2000A_PREVSTAT) or by comparing migration data to the state of current residence (GEO1_BR), if your analysis requires examining them separately.
2025-03-14 · General
Since a dichotomous variable assigns all observations into one of two categories (e.g., “yes/no”), it may be suitable for analyses that compare two different occupations or industries (e.g., nurses vs. doctors). However, it does not lend itself to analyses of all of the hundreds of different occupations and industries that appear in the data. It is possible to group these into a few large categories based on similarities. It isn’t clear to me how you plan to use a condensed occupation/industry variable, so I provide some possibilities for collapsing the categories and other variables that may be of interest below.
As an alternative, you might consider using EMPSTAT to group respondents in a dichotomous variable that reports whether they are or are not employed. You might also consider using the class of worker variable (CLASSWKR). The detailed version of this variable (click to see detailed codes in the codes tab) identifies respondents as part of one of four general groups:
- Self-employed (incorporated or unincorporated)
- Working for wages/salary at a private company (for-profit or non-profit)
- Working at different levels of government (federal, state, and local)
- Unpaid family workers
Since occupation and industry depend on each other significantly (e.g., most people involved in crop production have an occupation related to agriculture), it’s common to focus on either one or the other. The Census Bureau organizes occupation codes in samples collected from 2018-onwards into six large occupation category groups:
- Management, Business, Science, and Arts (OCC 10-3550)
- Service (3601-4655)
- Sales and Office (4700-5940)
- Natural Resources, Construction, and Maintenance (6005-7640)
- Production, Transportation, and Material Moving (7700-9760)
- Military (9800-9830)
With regards to industry (IND), the 2022 North American Industry Classification System (NAICS), which 2023-onwards Census industry codes are based on (see INDNAICS and this crosswalk), is organized into 20 major groups. One method to group these further would be into primary (agriculture and natural commodity extraction), secondary (manufacturing), and tertiary (services) sectors, but you may find a grouping that works better for your case.
2025-03-12 · USA
I’m glad we were able to connect through messaging and that you’ve able to submit API calls after posting on the forum. Our IT team suspects that this error was due to a temporary network issue. For those who may see a similar error message when using code that has worked in the past, the best thing to do is to wait 10-15 minutes and resubmit your request. In many cases, the network issue may resolve on its own during this time. It may also be helpful to review the IPUMS API changelog to see if any recent updates have introduced a breaking change to the API.
2025-03-12 · General
The most direct method would be to submit a public comment to a Census Bureau federal notice regarding data collection. You can find these by searching for documents with the heading “Agency Information Collection Activities”.
2025-03-12 · USA
Chip, thank you for your suggestion. I can see the value in being able to request data for a single PUMA. I’ve shared your suggestion with my colleagues as a feature to consider adding in the future.
2025-03-11 · General
IPUMS datasets generally record household rosters at a specific point in time, with family interrelationships identified within each sampled household. With few exceptions, the data only report on information about coresident household members (birth order is not recorded). While it is possible to make inferences on the birth order of children in cases where all of the children reside in the same household by observing the AGE of children who share the same value of MOMLOC and/or POPLOC (i.e., they have the same mother and/or father), the data is generally unsuitable for this task.
The main limitation is that this requires all siblings to be present within the sampled household. Siblings who previously moved out of the household, who have previously died, or those who have not yet been born will not appear in the data. We provide a user guide about these family interrelationship links with more details about how these links were created. You may be able to fill in some of the gaps using the variable CHBORN (children ever born; available in 1900-1910, 1940-1990). The Current Population Survey’s (CPS) Fertility and Marriage Supplement may also be helpful.
Regarding the birth order of spouses, I’m assuming that you’re asking about each spouse’s birth order in terms of their siblings (e.g., the spouse is the oldest sibling) rather than the age of each spouse relative to their partner (e.g., the husband being older than his wife). Determining the birth order of adult spouses is much more challenging since they likely no longer reside with their siblings. One potential method you may consider to obtain this information indirectly is leveraging the linked decennial census records in the IPUMS Multigenerational Longitudinal Panel (MPL).The MLP allows users to obtain crosswalks and data files linking deidentified persons across the 1850-1950 censuses. For example, you may link spouses in 1950 to their 1920 census records. This allows you to observe the family composition of each linked spouse from the period when they resided in the same household as their siblings (using the same method outlined for children above).
This method has a few shortcomings: 1950 is the most recent sample that is linked, the MLP only links records when it can confidently confirm that these are the same individuals, and, similarly to the method identifying the birth order to children, the snapshot that a decennial census family composition provides will miss siblings that may have previously died, siblings that have not yet been born, as well as any siblings who previously moved out of the household.
2025-03-11 · International · marked as solution
Thank you for bringing this to our attention. The link in the codes tab is incorrect and should instead reference coding for KE2019A_0466. You can refer to this page for coding of IND in this sample. Since IND codes industries using the original data provider’s classification system (i.e., it is unharmonized) our codebooks are unable to provide labels for this variable. For comparison, the codebook is able to provide labels for extracts that include INDGEN since this variable harmonizes industries into comparable groups such that the same code refers to the same set of industries across samples.
2025-03-07 · USA
I took a look at your extract and determined that the reason for this discrepancy is that there is one observation in your subsample that has PERWT = 0. When you svyset the data using PERWT, observations with missing and 0 weights are by default not included in the subpopulation.
The presence of respondents with values of zero for PERWT in the 2000 1% file is intentional. It is a result of the Census Bureau’s weighting strategy that assigns lower weights to persons who are overrepresented in the sample; it seems plausible that additional rounding could result in weights of 0. You can read more about the weighting procedure in the 2000 1% PUMS technical documentation.
2025-03-07 · General
It’s difficult for me to answer your question since the 2019 health survey you reference is not an IPUMS sample. However, you can read about the sampling methodology for the 2009 Vietnam census in chapter two of this report. In particular, it provides the relationship between the sampling rate for each district (each consisting of its own stratum of enumeration areas) with the sampling rates for each of the three regions. The report notes the number of districts in each region, but it doesn’t specify which districts correspond to each of the three regions; you may have to reach out to those involved with the 2019 health survey to determine which districts they selected and whether these correspond directly to the classification in the 2009 census. Otherwise, you can obtain the urban status of the enumeration area a household resided in using the variable URBAN; the district of residence is recorded in GEO2_VN2009.
2025-03-06 · USA
You’re correct that it’s not possible to use the select cases tool to filter by PUMA. We have focused on offering variables that we think are the most useful as filters; there are two main challenges with filtering by PUMA:
-
PUMA must be used in conjunction with a State code (STATEFIP or STATEICP) since PUMA codes repeat across states.
-
PUMA codes refer to different areas across time. Let me run through an example:
Minnesota PUMA code 600 refers to the area consisting of Chisago, Isanti, Pine, Mille Lacs, and Kanabec counties in ACS samples collected between 2012-2021. However, in ACS samples collected from 2022-onwards, a new vintage of PUMA codes is used where the same PUMA code instead refers to a completely different area consisting of Crow Wing, Morrison, Todd, and Wadena counties (you can verify this using our PUMA vintages map). If a user were to select the 2022 5-year ACS and had the option to request data only for Minnesota PUMA 600, they would obtain households surveyed in 2018-2021 in one area and households surveyed in 2022 from a different area.
2025-03-05 · International
Currently, IPUMS International provides Indonesian census and intercensus survey data from 1971 to 2010. We have been working on acquiring data from the 2020 census, but do not yet have access. I have passed your interest in the data along to my colleagues who work closely with the IPUMS International data.
You may consider reaching out directly to Badan Pusat Statistik (BPS) to ask about accessing the data yourself. We are always grateful when users who have, or who establish, connections with national statistical offices put us into contact with them; this contributes greatly to our efforts to facilitate use of a country’s census data by incorporating them into IPUMS International.
2025-03-04 · General
Hi Andrew,
Thank you for the kind words. We are very excited to hear about your plan to provide an easy method for users to exactly replicate your analyses of IPUMS CPS data! This sounds like an ideal application of our API, which allows researchers to share R code with the specifications for a data extract (samples, variables, and other options) that other users can run themselves to download and input the data directly in R. Our ipumsr documentation website provides a vignette with sample code for submitting API data requests using the ipumsr package. Check out the define_extract_micro() function in particular. The API provides most of the same functionality as the online extract system and we are happy to answer any questions that you have about the API. The only portion that cannot be automated is that each person looking to use your provided replication code will still need to spend a couple minutes creating an account on IPUMS CPS and obtaining their unique API key.
While I don’t have a time series of how IPUMS has grown, our 2024 IPUMS By the Numbers page should give you a sense of how we’ve grown over the past year. We do our best to keep track of publications using IPUMS data by recording them in our IPUMS Bibliography tool. You can use the tool to search by data collection, topic, or any of the other available filters. Once your papers or blog posts have been released, we would appreciate it if you could add them to the bibliography as well!
2025-03-04 · USA
I am noticing that you do not specify a weight variable anywhere in the code that you provided. To adjust for mixed geographic sampling rates, nonresponse adjustments, and individual sampling probabilities in the American Community Survey (more information of the ACS sample design), it is necessary to weight your estimates. PERWT is the correct weight for person-level estimates. We offer data training exercises with sample R code for implementing weights: exercise one and exercise two.
You might also be interested in our online analysis tool, which allows researchers to run simple analyses without needing to download the data themselves. I was able to run the analysis you mention using the tool by tabulating HINSCARE for the 2023 ACS with PERWT selected as my weight. The estimate that I got was that 18.9% of the US resident population was covered by Medicare, which replicates the statistic in the Health Insurance Coverage in the United States: 2023 report. Note that while IPUMS does not provide code review, we do answer questions about the data and documentation. I have shared some information about the HINSCARE variable below that seems relevant for your question, but please follow up if you have further questions about the data after running your analysis with weights.
HINSCARE refers to a question about Medicare coverage without reference to a particular Medicare part (FFS or Part C). No other question in the ACS asks about Medicare coverage, so presumably this should include all Medicare recipients. However, since the ACS is a self-administered questionnaire, interpretation of these questions is ultimately up to survey respondents themselves. You might also check if there are cases of other types of insurance by identifying respondents with HCOVANY = 2 (any medical insurance), but who do not report having any of the types that are separately identified.
2025-02-26 · Global Health · marked as solution
Your interpretation of these variables appears correct to me. FCDAGE_ALL reports the ages at cutting of each of the respondent’s daughters. The availability tab for this variable notes that it is provided for 15 countries in total, including for 11 Central and West African countries during survey phases 6 & 7. While FCAGEDAU is available for samples in survey phases 3-5, you are correct that this variable alternatively reports the age at cutting of the woman’s eldest daughter or the age at cutting of the most recently cut daughter. The universe tab for this variable provides a helpful overview for whether the sample refers to the former (universe statements that include “whose eldest living daughter is circumcised”) or latter (“with at least one living daughter who is circumcised”) definition. Regarding the Nigeria 1999 sample, the DHS Program notes that it “was not centrally involved in this survey and cannot stand behind the quality of this survey.”
You might create a comparable measure across these samples that reports the age at cutting of the respondent’s eldest daughter. For FCAGEDAU, the variable FCDLINENUM reports the line number of the most recently cut daughter. This variable can be used together with HHAGE on the household member’s unit to determine whether the age reported in FCAGEDAU refers to the eldest daughter or to a younger daughter. A consistent measure for FCAGEDAU would apply the same universe across samples by reassigning a code of 99 (“NIU”) to all households where this variable refers to a younger daughter.
2025-02-25 · USA
Thanks for messaging to let me know that you were able to get your extract to work.
As a reference for anyone else who might have this issue, our data extracts are by default compressed (*.dat.gz) files. Users need to decompress or unzip them before using them. We have noticed that operating system updates for Windows and Macs occasionally result in changes to the default decompression tools that cause unexpected behavior when decompressing/unzipping the .gz files. For this reason, we recommend 7zip as a free decompression software for Windows and The Unarchiver for Macs. These instructions explain how to input the decompressed .dat file into one of our supported stats packages. We also offer accompanying video tutorials that demonstrate this process.
Alternatively, it’s possible to request a data extract that’s formatted as a Stata, SAS, or SPSS file (available in the Extract Options menu before submitting the file for processing). The file will still need to be decompressed, but can then be opened directly into one of these stats packages.
2025-02-21 · USA
Am I understanding correctly that you are looking to estimate the proportion of PUMA’s population by race (i.e., the percent of the PUMA’s population that is White)? If so, I believe you will want to include RACE in your group_by function:
group_by(MULTYEAR = haven::as_factor(MULTYEAR), STATEICP = haven::as_factor(STATEICP), PUMA = haven::as_factor(PUMA), RACE = haven::as_factor(RACE)) %>%
You can then run your analysis using:
summarize(n = sum(PERWT)) %>%
mutate(pct = n / sum(n))
You can obtain this sample code in our data training exercises.
We also offer an online analysis tool that allows researchers to run these types of analyses without needing to use a stats package. If you’re interested, I recommend viewing this video tutorial to familiarize yourself with the tool.
2025-02-19 · USA
Aside from the documentation in the editing procedure tab for COSTELEC, I am not aware of any other adjustments such as those for seasonality. The Census Bureau provides a within-year inflation factor that researchers may use, but the decision to use this factor is left to the discretion of each researcher.
2025-02-19 · USA
COSTELEC is calculated by multiplying the monthly values reported in the ACS Public Use Microdata Sample (PUMS) by 12 with two exceptions: (1) variable-specific specialty/missing codes 9993 (“No charge or no electricity used”) and 9997 (“Electricity included in rent or in condo fee”) where no monthly electricity costs are provided, and (2) top coding.
To preserve respondent confidentiality, the Census Bureau edits the top 0.5% of reported values in each state/year pair and reallocates them to the median value in this top-coded group. For example, the 2023 original public use microdata sample from the Census Bureau sets the threshold for top coding of monthly electricity costs in Alaska at $1,000 and then assigns all households exceeding this cost a value of $2,400 (the group’s median). However, the maximum top code for IPUMS COSTELEC is currently fixed at $9,990; meaning that any state/sample-specific top code for monthly electricity expenditures that exceeds 9,990 when multiplied by 12 will be recoded to 9,990 by COSTELEC despite this being lower than the top-code reported in the original data. I have a message out to my colleagues to have this issue addressed. However, this only affects roughly the top 1% of values in the 2023 ACS. Note that COSTGAS also has the same issue of a fixed top code being enforced by the IPUMS recoding protocol.
It’s possible to run a direct comparison with published monthly figures using the unedited PUMS monthly value that we provide in the source variable US2023A_ELEP. I’m unsure which Census aggregate tables you are comparing your estimates to, but I was able to find this one that provides estimates of the number of households across six brackets of monthly electricity expenditures. Below, I’ve shared my estimates using IPUMS data for each of these brackets (weighting my analysis with HHWT and restricting to a single observation per household using PERNUM == 1). I drop households with the variable-specific codes 9993 and 9997. These estimates are overall very close to the figures reported in the table (~2% off) and are identical whether I estimate using the monthly source variable or COSTELEC/12 (because the highest interval of the monthly expenditures is 250 or more, and 250 is below the IPUMS-imposed top code of 9990, in this specific case the two are equivalent). While these estimates are not within the published margin of error, they certainly bear much resemblance. I suspect that any remaining difference is due to the fact that the table is produced using the internal restricted data file which includes the entire ACS sample (the PUMS includes about 2/3 of the entire sample) as well as unrounded values (the PUMS rounds values to the nearest $10).
Less than $50: 6,081,040
$50 to $99: 24,265,416
$100 to $149: 27,716,062
$150 to $199: 21,306,611
$200 to $249: 16,104,809
$250 or more: 29,737,541
2025-02-11 · Health Surveys
Basic sociodemographic data such as education (e.g, EDUCREC1, HIGRADE1) is available in the NHIS for all persons in the household through 2018. In households where a child resided with their parent, users can identify their parent’s record using the IPUMS-defined family interrelationship variables MOMLOC and POPLOC. You can then obtain the parents’ education from their records.
Our attach characteristics tool helps simplify this process by attaching the characteristics of a person’s coresident parent as a new variable on that person’s record . To access the tool, you will need to add variables of interest to your data cart. You can then click to view your data cart to find the tool on the Extract Request page (see screenshot below). The new variable will have the suffix _pop/_mom to denote that it’s the respondent’s mother’s/father’s value and the prefix corresponding to the variable that it’s reporting (e.g., higrade1*, for higrade1_mom).
While you only asked about 1991-1995 data, I want to note that beginning in 2019 the NHIS no longer releases core sociodemographic measures for all persons in a household (see our user note on the 2019 redesign), so the attach characteristics feature is not available for 2019-forward IPUMS NHIS data.
2025-02-11 · USA · marked as solution
Your estimates are from ACS data, but the statistics in the table you link to are sourced from the Current Population Survey’s March Annual Social and Economic Supplement (CPS ASEC). This Census Bureau fact sheet highlights some of the differences between these surveys and why we would not expect their estimates to line up exactly. Significantly, these differences include:
- ACS participants are surveyed throughout the year and report income earned over the previous 12 months. This means that income earned in 2022 is included in the 2023 ACS. In contrast, CPS ASEC respondents are asked to report income earned in the previous calendar year.
- The ACS is a self-administered survey that is mailed to respondents, while the CPS sends trained enumerators to regularly survey households in-person. These enumerators ask more detailed questions about different income sources that ACS respondents might overlook, which may result in CPS estimates being greater than those in the ACS.
When I estimate 2023 median household income in the 2024 CPS ACS using the IPUMS CPS online analysis tool, I obtain a value of $80,066. This is off by less than 1% from the published value and is within the 90% confidence interval provided in table A-1 in the report you link to.
The remaining difference is likely due to income being rounded to two significant digits in the Public Use Microdata Sample (PUMS) released by the Census Bureau, while the internal file for the table uses the unrounded values.
2025-02-07 · USA
Beginning in 1950, the original public use microdata samples do not directly identify the county of residence; the specific geographic detail varies slightly in the 1950-forward data and IPUMS geographers infer county of residence, where possible, from the provided identifiers. The only geographic identifier that’s released for the 1950 samples is the State Economic Area (SEA). SEAs are generally single counties or groups of contiguous counties within the same state. For 1950, we can identify county of residence only when the corresponding SEA consists of a single county (see the COUNTYFIP description page for more detail on this protocol).
Note that since the release of the 1950 full count census records there is the possibility for more detailed geographic measures. Specifically, enumeration districts (IPUMS variable ENUMDIST) are assigned to each household in the data and can be associated with other geographic units such as counties. Unfortunately, we do not yet offer the ENUMDIST identifiers for the 1950 full count data, but plan to release these in the future. If you are interested in accessing a preliminary version of the ENUMDIST variable for 1950 that can be used to construct counties. Note that enumeration district data is not available for the IPUMS 1960 samples; PUMAMINI is the most detailed geographic identifier available in the 1960 5% sample.
Finally, if your focus is on obtaining county-level aggregates rather than individual-level microdata, then you might take a look at tabular or summary file data from IPUMS NHGIS. The project allows users to download decennial census summary statistics on the county level for each decennial census (as well as other geographic levels for more recent samples). Tables can be filtered and downloaded through the data finder tool; we offer an FAQ page and short video tutorials to help familiarize new users with the website.
2025-02-06 · USA
IPUMS USA offers the variable CPUMA0010, which bridges the 2000 and 2010 PUMA boundary vintages. By aggregating 2010 PUMAs together until their combination aligns (within 1% population margin) with one or more 2000 PUMAs, changes in boundaries are absorbed into this new CPUMA0010 geographic unit. Once you’ve matched school districts to their corresponding vintage PUMA, you can use the summary file on the CPUMA0010 definitions page to match them to the corresponding consistent PUMA.
2025-02-05 · USA
This IPUMS USA user guide reviews the available health insurance variables. HINSEMP should be used to identify whether a person has health insurance through their or another family member’s employer, former employer, or union. Based on my initial inspection, I am not able to identify any differences between HINSEMP and HINSEMP2; I recommend using HINSEMP because it has broader sample coverage and is consistently referenced as the appropriate variable to use. I have a request out to the IPUMS USA team to revise the HINSEMP2 text to differentiate it from HINSEMP or remove it if they are indeed duplicative.
Note there is no way to definitively determine if the person had insurance directly through their employer or through another family member using IPUMS USA. However, you may be interested in the variable HIUID and HIURULE, which report health insurance units within a household (HIUID) and the rule used for identifying the health insurance unit HIURULE). This provides additional background of how coverage is determined, but is based on a set of assumptions outlined in the variable descriptions and linked documentation.
More detailed health insurance data is available through the Current Population Survey that we release on IPUMS CPS (view the entire variable group). This includes the variable GRPOWNNW, which identifies individuals who are the policyholder for current employment-based insurance.
2025-02-05 · General
This IPUMS USA user guide reviews the available health insurance variables. HINSEMP should be used to identify whether a person has health insurance through their or another family member’s employer, former employer, or union. Based on my initial inspection, I am not able to identify any differences between HINSEMP and HINSEMP2; I recommend using HINSEMP because it has broader sample coverage and is consistently referenced as the appropriate variable to use. I have a request out to the IPUMS USA team to revise the HINSEMP2 text to differentiate it from HINSEMP or remove it if they are indeed duplicative.
Note there is no way to definitively determine if the person had insurance directly through their employer or through another family member using IPUMS USA. However, you may be interested in the variable HIUID and HIURULE, which report health insurance units within a household (HIUID) and the rule used for identifying the health insurance unit HIURULE). This provides additional background of how coverage is determined, but is based on a set of assumptions outlined in the variable descriptions and linked documentation.
More detailed health insurance data is available through the Current Population Survey that we release on IPUMS CPS (view the entire variable group). This includes the variable GRPOWNNW, which identifies individuals who are the policyholder for current employment-based insurance.
2025-02-04 · CPS
IPUMS USA and IPUMS CPS use the Public Use Microdata Sample (PUMS) files released by the Census Bureau to offer harmonized versions of the data files. We do not remove any records from the ACS or CPS PUMS files.
The ACS PUMS microdata itself is a subsample of the full ACS microdata collected. The ACS PUMS includes only about two-thirds of the full ACS sample used to produce official ACS estimates (these summary files are available via IPUMS NHGIS). Regarding the CPS, I am unable to find documentation that notes that the CPS PUMS is a subsample of any full CPS file. However, I do know that cases in the CPS PUMS have their ages perturbed and some geographic identifiers are additionally synthesized to further protect confidentiality.
Our default data format for custom data downloads from our website rectangularizes data onto the person record, meaning that any household-level variables will be appended to the person record (and all persons within the same household will have the same values for these variables)–as a result, these custom download files will omit records for households without any person records (i.e., vacant households). To include empty households in your custom data request, you will need to request either a Hierarchical or Household records only data structure for your data files.
2025-02-04 · Health Surveys · marked as solution
The Bureau of Labor Statistics classifies persons as unemployed if they do not have a job, have actively looked for work in the prior 4 weeks, and are currently available for work. People who are not in the labor force are defined as those who are neither employed nor unemployed.
However, depending on your research question it may be more appropriate for you to combine persons who are unemployed and not in the labor force into a single category.
2025-02-03 · USA
I can comment about specifics that you should be aware of for your analysis, but confirming whether your code is correct is beyond the scope of our user support team. Having scanned through your code, I can share two additional thoughts that come to mind:
- IPUMS USA provides a tool that attaches characteristics of a person’s coresident parent(s) or spouse as a new variable on that person’s record (e.g., mother’s education, spouse’s employment status); these variables use the IPUMS-generated family interrelationships reported in MOMLOC/POPLOC and SPLOC. This tool is available in the Extract Options window right before you submit your extract for processing.
- PERWT is constructed to sum to the total US resident population in each year. Therefore, your weighted n estimates that use two years of ACS data are about double the size of your population of interest. While this does not pose any issues for regression analysis or constructing ratios, estimates of population-level aggregates (e.g., the total number of Mexican-origin Hispanic adult children living with their parents in the US) should be divided by two.
2025-02-03 · USA
Summary tables from the ACS are released by IPUMS on our spatial project website IPUMS NHGIS. We recommend new users familiarize themselves with the website by reviewing the detailed FAQ page as well as the short video tutorials on our user guide. These tables can be found in the data finder tool by using the topics filter and selecting “Housing Value and Costs - Rent and Renter Costs”.
You can also obtain housing cost statistics using the person-level ACS microdata on IPUMS USA. While there is no separate variable that reports these values in IPUMS USA, users can construct these measures using OWNERSHP to differentiate between renters and homeowners and the variables RENT/RENTGRS, MORTAMT1/MORTAMT2, and HHINCOME to calculate the percentage of household income spent on housing. Note that the rent and mortgage values are monthly costs, while HHINCOME reports annual income.
It’s possible to create and analyze this type of variable in our online analysis tool without downloading a microdata extract. After selecting a sample in the linked page, navigate to the Create Variables button on the top left to enter the variable creation tool. The Compute tab allows users to write their own syntax to compute a new variable. Below is the syntax to create such a housing cost ratio variable.
 if (OWNERSHP eq 1)
 Housing_Cost_Ratio = (MORTAMT1*12)/HHINCOME
 else if (OWNERSHP eq 2)
 Housing_Cost_Ratio = (RENT*12)/HHINCOME
2025-01-31 · General
Summary tables from the ACS are released by IPUMS on our spatial project website IPUMS NHGIS. We recommend new users familiarize themselves with the website by reviewing the detailed FAQ page as well as the short video tutorials on our user guide. These tables can be found in the data finder tool by using the topics filter and selecting “Housing Value and Costs - Rent and Renter Costs”.
You can also obtain housing cost statistics using the person-level ACS microdata on IPUMS USA. While there is no separate variable that reports these values in IPUMS USA, users can construct these measures using OWNERSHP to differentiate between renters and homeowners and the variables RENT/RENTGRS, MORTAMT1/MORTAMT2, and HHINCOME to calculate the percentage of household income spent on housing. Note that the rent and mortgage values are monthly costs, while HHINCOME reports annual income.
It’s possible to create and analyze this type of variable in our online analysis tool without downloading a microdata extract. After selecting a sample in the linked page, navigate to the Create Variables button on the top left to enter the variable creation tool. The Compute tab allows users to write their own syntax to compute a new variable. Below is the syntax to create such a housing cost ratio variable.
 if (OWNERSHP eq 1)
 Housing_Cost_Ratio = (MORTAMT1*12)/HHINCOME
 else if (OWNERSHP eq 2)
 Housing_Cost_Ratio = (RENT*12)/HHINCOME
2025-01-31 · USA
The flags QINCTOT and QHHINCOME have two different codes in the ACS:
0 = “Original entry or inapplicable (not in universe)”
4=“Allocated”
An observation is not in universe for a particular variable when there is no data recorded for it. For example, the ACS does not ask for the income of children under the age of 15. Instead, all of these records are assigned the not in universe value (9999999 for INCTOT). The definitions for each variable universe can be found in the universe tab (see INCTOT and HHINCOME).
The discrepancy you’re seeing is due to the differences in universes between these variables. While INCTOT is provided for all people ages 15+, HHINCOME is not provided for households that are classified as “group quarters” (e.g., correctional institutions, assisted living centers for the elderly, military bases, religious convents, etc.). An individual residing in group quarters (GQ = 3 or 4) may have personal income, but they will never have household income since they are not in the universe for this variable. As a result, HHINCOME = 9999999 and QHHINCOME = 0, “Original entry or inapplicable (not in universe)” for all respondents in group quarters.
FTOTINC is constructed by IPUMS; it sums the INCTOT values of all family members as defined by FAMUNIT (see CBSUBFAM for the Census subfamily definition). Unfortunately, the association of FTOTINC with the data quality flag QFTOTINC is incorrect; QFTOTINC is directly reported by the Census Bureau for their measure of family income (with the variable mnemonic FINCP in recent years). The IPUMS variable FTOTINC does not use FINCP, so it is misleading to interpret the QFTOTINC variable alongside FTOTINC. I have made a note to remove this association. Despite this error, I can share some information that may be helpful for your immediate consideration. It appears straightforward enough to me that you can consider respondents with QINCTOT = 4 who reside in singleton households that are not group quarters as having edited FTOTINC values (QFTOTINC = 4).
2025-01-31 · USA
Hi Anna,
Thanks for reaching out; it’s good to hear from you! I hope that I can clarify the data better to help you decide how to best proceed with this project.
RELATE reports the relationship of each person in the household to the householder (identified with PERNUM = 1). The householder can be anyone in whose name the housing unit is owned or rented under. Unlike RELATE, which comes directly from the public use microdata file, MOMLOC and POPLOC are created by IPUMS to aid researchers in analyzing parental relationships. There are two main differences in the links provided by MOMLOC/POPLOC when compared with RELATE:
- They include (probabilistic) parental relationships where neither person is the householder.
- They will report the unmarried spouse of a child’s parent as their parent (in addition to including step- and adoptive parents).
I highly recommend reviewing the detailed documentation pages for MOMLOC/POPLOC to determine if you would like to leverage this additional information. Note that these parental links are used for our attach characteristics tool (available in the last screen before submit your extracts). Using this tool, you can use the variables in your data cart to add data about a person’s mother, father, household head, or spouse as an additional column in your data extract. For example, you can append mother’s and father’s age to the person’s record for analysis.
Your restriction to GQ = 1 and 2 misses a few households with GQ = 5. These are households containing 10 or more individuals unrelated to the household head. Note that SERIAL is only unique within each IPUMS sample; serial numbers will repeat between your 2010 and 2011 samples. Instead, you should group using a combination of SAMPLE and SERIAL.
I’m finding that 10.6% of people aged 18+ with Hispanic Mexican origin living with their mother (MOMLOC > 0) in 2011 were married, while the corresponding figure for those living with their father is 9.6%. I also found a mean age of 25.03. This seems consistent with your estimates.
2025-01-30 · General
Please note that IPUMS strictly prohibits using the data for genealogical purposes. For genealogical research, you will need to request data through an organization such as Ancestry.
Accessing the residential addresses of persons in the full count decennial census microdata on IPUMS USA requires applying for a restricted use data license through an educational or research institution such as a university. Using just the publicly available data, you can obtain the census enumeration district (ENUMDIST) for persons in census samples from 1880-1940. You will then need to find a resource that provides the boundaries for enumeration districts: the National Archives and stevemorse.org are good places to start. No geographic identifiers below the city level are available prior to 1880 in the public data. You may also find it helpful to know that we provide the latitude and longitude coordinates (YGPS and XGPS) of the addresses of persons residing in one of the 39 cities (Portland is not included) mapped by the Urban Transition Historical GIS Project for the 1880 census. Once you’ve added the geography variable that works best, you can add occupation (OCC) to your customized data extract. Our FAQ page and short video tutorials can help familiarize you with IPUMS data and our extract system.
2025-01-30 · CPS
It appears that the 3.3% statistic refers to the total population aged 60 and over who will never receive social security benefits rather than those who do not currently receive benefits. For example, the pie chart on the right hand side notes that 1.3% of these 3.3% never beneficiaries die before receiving benefits. Data from the CPS produces estimates of the number of people who received social security benefits in the previous year.
This report from the Social Security Administration notes that about 52.7 million seniors aged 65 or older received social security in June 2023. Using the 2024 CPS ASEC (since income is reported for the previous calendar year), I get an estimate of 47.5 million recipients of social security aged 65+ (out of a total of 59 million people in this age group).
One factor that might be driving this discrepancy is that the CPS does not sample institutional group quarters (see page 58 of the CPS technical paper 77 regarding the sample frame). Noninstitutional group quarters are facilities for people who are not under formally authorized and supervised care and custody such as college housing, group homes for adults, workers’ living quarters, and convents. Institutional GQs include facilities such as prisons, skilled nursing facilities, and residential treatment centers for juveniles. Since weights in the CPS scale the sample to be representative of the US noninstitutionalized population, estimates using the CPS will miss this population.
2025-01-30 · USA
Hi Molly,
As Dan Backman shared in this post, IPUMS staff are currently processing the 2019-2023 5 year ACS microdata. We expect these to be complete within the next few weeks and will notify registered users via email when they are available. Hope that helps you make a decision on how to best proceed with your research.
2025-01-29 · Global Health
The STRATUM variable used in the construction of IMICSSTRATUM is only available for the household unit of analysis in the original MICS dataset. We have not created a stratum variable for other units of analysis. As you suggest, to obtain this variable you will need to download a separate household data extract using the Household Characteristics unit of analysis. Once you have both files, you can follow the instructions in this guide to merge the data together.
2025-01-29 · USA
Thank you for sharing this additional information that the Census Bureau provided to you.
It appears to me that the 2011 rule that “for those with a mortgage, we didn’t allow a ‘none’ amount to be included in the hot deck” is driving the change that you’re seeing in 2011. Specifically, households with a mortgage who skipped the question or reported no property insurance could previously be allocated to not having any property insurance (i.e., PROPINS = 1 & QPROPINS = 4) if a ‘none’ amount was selected from their hot deck (see this guide on different allocation methods). The rule change removed the ‘none’ option from their hot deck, making it necessary for them to be allocated some positive amount of property insurance. In other words, the 12,742 cases in 2010 from your screenshot that were allocated to having no property insurance could no longer be allocated to this option in 2011 and instead were allocated to some value of PROPINS > 1.
2025-01-23 · USA
Top-coding occurs in the ACS when a response to a particular question exceeds a certain threshold. For example, participants who report wage income above a certain threshold (e.g., $500,000) have their wage income top-coded by replacing the reported value with a different value. Top-codes for each variable are dynamic and vary by state and year. The maximum value that you see in the data (158 minutes) only refers to the top-code for a single state in a single year. Top-codes are typically applied to encompass the top 0.5% of values in each state for each year. The values that are selected for top-coding are replaced with the mean value of the cases selected for top-coding. If there were only two respondents who reported their wage income above the $500,000 threshold in the example above (e.g., $600,000 and $700,00), both of their wage incomes would be reported instead as $650,000.
The “top-code state minimum value” refers to the threshold value used for top-coding since it is the minimum value for which responses received a top-code. It can be found in the original PUMS .csv file at the bottom of the page that you link to. The column titled JWMNTPCT reports the threshold value for TRANTIME while T_JWMN reports the value that top-coded responses to TRANTIME were assigned.
2025-01-22 · General
Please note that IPUMS strictly prohibits using the data for genealogical purposes. For genealogical research, you will need to request data through an organization such as Ancestry.
Accessing the names of persons in the full count decennial census microdata on IPUMS USA requires applying for a restricted use data license through an educational or research institution such as a university (the variables NAMEFRST and NAMELAST are only provided in the historical representative samples (containing between 1%-10% of all records) for public use. IPUMS International provides person-level microdata that includes the first and last names (NAMEFRST and NAMELAST) of all persons in the 1850 and 1880 US decennial censuses. To access this data, you will need to apply with a proposed research project description as well as provide identification so that we can verify your affiliation with an educational or research institution.
2025-01-17 · International
IPUMS International disseminates census data and works to provide a consistent coding structure across countries and over time to facilitate comparative research. Two different types of variables are released as a result: harmonized variables that provide a consistent coding structure, and source variables that correspond to the variables in the original datasets submitted to the IPUMS project (see this FAQ section for more detail).
The harmonized variable ETHNICCL provides ethnicity data from Chile for 2002 and 2017. However, data from 1992 has not been harmonized into this variable due to the smaller amount of detail available in that year. Instead, you can find the original data for this variable in the source variable CL1992A_INDIG. Source variables can be found by either using the search tool and checking the Include source variables box or by selecting the Source Variables option in the variable selection page (after adding samples to your data cart) and using the dropdown Household, Person, or Sample menus.
2025-01-14 · General
While I wasn’t able to find any external benchmarks for your filtering criteria, your estimates seem consistent overall with this summary ACS table which shows that median earnings of the population 16 years and over with earnings in 2018 was $35,291 (±49). While your estimate using INCTOT includes other sources of income besides earned income, your findings are not unreasonable based on the published data. You might try replicating these published estimates to check your method and then apply your filters.
We recommend using the filter PERNUM = 1 for household-level analyses (e.g., to estimate household income quintiles) since this restricts the data to only a single observation from each household. As a result, each household is only counted once. Since you’re running a person-level analysis, you should not include this filter. Be aware that the famsize value that you calculate counts the number of people in each household. Since a household refers to a sampled housing unit, a single household can contain one or multiple unrelated persons. See IPUMS created family variables FAMUNIT and FAMSIZE for information about families.
2025-01-08 · USA
Thank you for your careful consideration of the terms of use for the IPUMS full count census files.
To link full count census data and agricultural census schedule data using names and available geographical information, you will likely need to apply to access the restricted use files. The publicly available full count files on IPUMS USA do not contain respondent names (the representative 1%-5% samples contain names in NAMEFRST and NAMELAST). Due to the size of the representative samples, only a small portion of your population of interest will be linkable using names in the public files. It is possible to obtain respondent names in the 1850 and 1880 full count files through IPUMS International (see the historical US samples 1850a and 1880a), but these do not allow for linking with the Multigenerational Longitudinal Panel (MLP). The restricted use files however allow you to obtain access to the names and addresses of your population of interest as well as link them using the MLP.
If you plan to apply for the restricted use data for this analysis, then we may be able to provide you with permission to link the data from the enumeration images. This will depend on the specifics of the project and what data you plan to disseminate. If you plan to apply for the data, please reach out to us at ipums@umn.edu with some more information about your project and I will be able to share the application materials with you.
2024 · 194 replies
2024-12-27 · USA
I’m glad to hear that my response helped clarify some things! Your theory that Census stopped reallocating insurance values > 2% of home value in 2011 seems possible to me. We would be happy to update our documentation if you find that this is the case.
2024-12-19 · USA
This jump that you are seeing in property owners reporting no property insurance costs (PROPINSR = 1) in 2008 is also present in the original PUMS data released by the Census Bureau. It appears to be due to a change in how the Census Bureau allocated property insurance costs for respondents with OWNERSHPD = 13 (“Owned with mortgage or loan”) who reported no costs or left the question blank. In 2007, every household with this pattern was either allocated a value for property insurance costs or was eventually assigned a value of $0. This appears to correspond to the following editing rule (in force from 2003-2007) from the editing procedure tab for PROPINSR:
If the reported insurance payment (PROPINSR) for an owner-occupied unit (OWNERSHP) is 0 or blank, it will be allocated. The allocated value is the PROPINSR value from another unit with the same ownership status (OWNERSHP), the same type of building (UNITSSTR), similar value (VALUEH), and in the same geographic unit (it is not specified what level of geography is used).
However, this editing rule seems to not have been applied in 2008 when 30,443 respondent households with this pattern (OWNERSHPD = 13 and none/blank reported property insurance costs) were not reallocated a value for their property insurance costs (see the screenshot below from our online analysis tool). These households account for about 70% of the increase in owner-occupied households reporting no property insurance costs between the two years. While rules for allocating missing values for PROPINSR exist in the 2008-onwards ACS samples, they all include additional stipulations regarding the values for other variables. Moreover, the editing procedure refers to allocating cases where PROPINSR is missing, but there are no procedures noted for reallocating responses of $0/none.
Most of the remaining change appears to be caused by an increase in the number of household respondents with OWNERSHPD = 12 (“Owned free and clear”) who reported a value for property insurance costs, but were reassigned to a value of $0. Two of the editing rules introduced in 2008 strike me as potential culprits behind this edit:
- For an owner-occupied unit (OWNERSHP), if the property insurance (PROPINSR) is more than 2% of reported property value (VALUEH), PROPINSR will be replaced with a missing value.
- For an owner-occupied unit (OWNERSHP), if property value (VALUEH) is reported and property insurance (PROPINSR) is missing, PROPINSR will be allocated.
For more information, I recommend sending your question to the experts at Census (census.askdata@census.gov) or posting it on the ACS data users discussion forum. We would be happy to update our documentation if you learn anything more about this!
2024-12-13 · Health Surveys
It’s straightforward to identify parents of 4-year-olds in IPUMS NHIS samples from 1997-2018. You can either use a modified version of the code provided in the IPUMS USA user guide that you referenced, or the attach characteristics tool in the extract engine. Both methods will give you the same results since they utilize the parental links in MOMLOC and POPLOC, though it may be more straightforward to use the code since the tool does not attach the characteristics of children onto the parent records (rather it attaches parental information onto child records). Note that MOMLOC and POPLOC and the attached characteristics feature are based on IPUMS-constructed parent-child links, and identify the child’s biological, step, or adoptive parent in the household. This includes identifying the spouse or unmarried partner (in the case of householder/unmarried partner pairings) of a child’s parent as the child’s other parent.
You are correct that identifying all parents of 4-year-olds is not possible with NHIS data from 2019 and later. The 2019 NHIS redesign restricted data collection to a single randomly selected sample adult (identified with ASTATFLG) and a single sample child (identified with CSTATFLG) per family. In most cases, the sample adult is the parent of the sample child (reported in ISPARENTSC). However, the lack of a full household roster makes it impossible to determine the ages of all children in a household from 2019-onwards. IPUMS NHIS does not offer family interrelationship variables or the attach characteristics feature for 2019-forward NHIS data.
You are correct that the state of residence is not available in the public use files. You may be interested in our user notes on (1) unique identifiers and linking keys in the NHIS and (2) linking IPUMS NHIS data with restricted-use versions from NCHS, which includes sample proposal language to reference. You can use NHISPID, created by IPUMS NHIS by concatenating identifiers in the public use file, to link records between the IPUMS NHIS and public use files. For records from 1997-2018, the identifier is composed of the following components: a prefix (“00”), the four-digit YEAR, the six-digit household number (HHX), the two-digit family number (FMX), and the two-digit person number (PX). Note that in the 2004-2018 samples, PX in IPUMS NHIS is actually called FPX in the NCHS data. From 2019-onwards, NHISPID includes a three-digit prefix (“000”), the four-digit YEAR, an “H” followed by the six-digit household number (HHX), the one-digit person number (PERNUM), and a trailing “0”.
2024-12-13 · General
As mentioned in this post, we plan to add a new CPUMA1020 variable that creates areas that can be consistently identified with either 2010 or 2020 PUMAs, as used in ACS samples from 2012 through (prospectively) 2031. We aim to release the CPUMA1020 variable sometime within the next year. We will look into extending CPUMA0010 to identify consistent areas for the entire 2000-2031 time frame, but we don’t have plans for that yet.
In the meantime, you might consider creating your own crosswalk of 2020 census tracts to CPUMA0010. The Missouri Census Data Center Geocorr tool can be used to generate a relationship file between 2020 census tracts and 2010 PUMAs (referred to as 2012 PUMAs in the tool). From there, you can match the census tract’s 2010 PUMA to the corresponding CPUMA0010 value using our composition and relationship files. This method avoids having to create a new consistent PUMA definition, but it is an imperfect solution since you will have a number of 2020 census tracts that do not perfectly map onto a 2010 PUMA. Matching all of the tracts to a single 2000-2031 PUMA will require creating a new consistent PUMA definition.
2024-12-11 · General
Hi Evan,
HISTID does not identify the same individual across decennial census samples; it identifies the same record across different release versions of the IPUMS historical full count data. New versions of the full count data may change values for some variables (e.g., occupation) or even eliminate records (e.g., we may combine households or drop what appears to be a duplicate record); HISTID allows researchers who have downloaded the full count data to track how the individual records have changed after a new version is released. I think what you’re looking for is the Historical Identification Key (HIK), which links the HISTIDs of people identified using the IPUMS Multigenerational Longitudinal Panel (MLP) algorithm across the full count decennial files.
There are currently two methods provided for using the IPUMS Multigenerational Longitudinal Panel (MLP) to link people across different decennial censuses. The first utilizes the link census data option when adding full count samples to your data cart. This option generates a long data file where each person has an observation in each census sample, filtered to people who are linkable using our algorithm. HIK is automatically added to these extract types. However, this method currently does not allow for linking to the 1950 full count (we hope to update the data access system to include these links sometime in 2025).
The second method is to use our linking crosswalks, which match HISTID values for each person across the full count decennial samples. This is currently the only way to link individuals in the 1950 census and includes the latest version of IPUMS MLP links. It sounds like you have already downloaded the 1940 and 1950 full counts separately; the next step is to download the 1940-1950 10-year crosswalk and use it to merge records between the two data files (see the user guide for sample code). Hope this helps clarify the data!
2024-12-10 · USA
The Census Bureau revises PUMA boundaries and codes every decade to align with new population data obtained from the decennial census. While some PUMA boundaries remain the same (potentially only changing their code), others can be shifted, aggregated, or broken up into multiple PUMAs. This type of revision occurred in 2022 such that ACS samples from 2012-2021 use one set of PUMAs and samples from 2022-2031 use a different set. As a result, consistent comparisons of PUMAs across these vintages is only possible in cases where boundaries did not change. You can use the map and crosswalks on this user guide page to investigate changes in PUMA boundaries and their codes.
2024-12-09 · Time Use
FTOTVAL is collected as part of the CPS Annual Social and Economic Supplement (ASEC) – see the availability tab for this information. ATUS respondents who are not interviewed in March (when the ASEC is fielded) will not have any value for this variable. To have been sampled in the ASEC and linked to the ATUS, a household’s final interview month (identified in MONTH_CPS8) must be in March, April, May, or June. FAMINCOME however comes directly from the CPS variable FAMINC, which is collected in every month of the CPS. A continuous measure of total family income for ATUS respondents can therefore only be obtained for those who can be linked to their ASEC record.
You might alternatively use EARNWEEK and SPEARNWEEK to obtain a continuous measure of combined weekly earnings from jobs worked by the ATUS respondent and their spouse/unmarried partner. Note that earnings for unemployed and self-employed ATUS respondents are unavailable; they are assigned EARNWEEK = 99999.99. Similarly, unemployed and self-employed spouses are assigned SPEARNWEEK = 99999.99. If the ATUS respondent does not have a spouse, SPEARNWEEK is set at 99999.98.
You may also be able to leverage ATUS links to the CPS data to obtain weekly earnings data for other household members who are not the ATUS respondent or their spouse. If you can identify all of the members of an ATUS respondent’s household in the CPS, you can sum each member’s EARNWEEK2 value to obtain total weekly wage/salary earnings for all employed household members.
2024-12-05 · Health Surveys
The imputed income point estimates were not included with the initial releases of the 1997-2008 NHIS samples by the NCHS, but were instead all released in 2010. Now that our IPUMS NHIS team is aware of their availability, they will look into providing them via IPUMS NHIS in the future. You can check our revision history page to see when they are released. In the meantime, you can obtain the data from the NCHS website and merge it with an IPUMS data extract that includes your variables of interest. Please see this detailed guide on how to link the two files.
2024-12-05 · CPS
I was able to replicate this strange pattern and can confirm that this was the result of an error in the original ASEC file released by the Census Bureau (see footnote 17). In looking into your question, we discovered that the Census Bureau released a revised version of the 2020 ASEC file on 4/1/21 (six months after we released the file on IPUMS CPS using the version of the data that was publicly available at that time). The revised file made corrections to four variables: LJCW (harmonized by IPUMS into CLASSWLY), two other variables that are recoded versions of LJCW (CLWK and WECLW), and NOEMP (harmonized by IPUMS into FIRMSIZE).
I downloaded this new version from the Census Bureau ASEC data page and it appears to have fixed the issues with CLASSWLY that you are finding for these occupations. I will let our team know that the file was updated so that they can incorporate these changes into one of our upcoming data releases. In the meantime, you might consider downloading the 2020 ASEC file directly from the Census Bureau and merging it with an IPUMS data extract in order to obtain the corrected data. You can merge person records across the two files using the linking keys HRHHID, HRHHID2, and LINENO (referred to as PULINENO in the CB data).
Thank you for bringing this to our attention!
2024-12-03 · General
The documentation I referenced is the NFHS-3 Supplemental Documentation that was included with my download of the survey dataset from the DHS Program. You can download the survey data with this document from the summary page on the DHS Program website.
The IPUMS DHS team looked into the issue and determined that we will be integrating the scrambled PSU codes into IPUMS DHS and releasing the PSU-level variables for this sample. It may take some time to update these variables on the website. To get the data sooner, you can download the PSU identifiers directly from the DHS Program and merge this with an IPUMS DHS extract that contains the variables that you are interested in. Alternatively, you can also use CLUSTERNOALL (available for the India 2005 sample on IPUMS DHS), which reports the cluster number for household members. In both cases, you will need to calculate the PSU or cluster-level weighted averages yourself. To do so, you should restrict your sample to one person per household (rather than counting records for each household member) and calculate a weighted average using HHWEIGHT. The weighted estimate should then be multiplied by 100 to convert the fraction to a percentage.
Thank you for letting us know about this! We’re happy to be able to add new contextual variable data to help researchers interested in this sample in the future.
2024-11-26 · Health Surveys
The MEPS variable builder creates an additional variable for each person in the sample that summarizes the number of events or total expenditures based on the selection criteria that you use. For example, it can give you the number of dental visits and the amount a respondent spent out of pocket for dental visits for a specified time period (months, interview rounds, or over a year). Records with a 0 for the created variable identify people who had no visits or expenditures based on your criteria. The tool does not drop observations based on the specified conditions or payment methods.
Note that there are a number of cases where you may obtain a zero for the number of events or the expenditure amount even when there are events/expenditures that satisfy your criteria (see the variable builder instructions page. For example, payments from other public sources (EVEXPOPU) and other private sources (EVEXPOPR) were discontinued after 2018. If these variable filters are selected for the construction of a variable using Add Up Expenditures operation, they will be treated as $0 expenditures in 2019 and later years. If they are selected for the construction of a variable using the Count operation, a value of 0 will be returned. Additionally, events with the Other Medical Expenses event type do not have an associated calendar month value (represented as an “NIU” value selection under the “Calendar Month” section in the variable builder). Any specific month selections other than NIU will result in the exclusion of Other Medical Expense event type records, even if Other Medical Expenses are selected under the “Event Type” menu.
Additionally, you may get zeros when filtering your criteria too narrowly. While the variable builder interprets selections within the same category (or tab) as “OR” selections (e.g., including payments using Medicare or Medicaid), the variable builder interprets selections across different categories (or tabs) as “AND” selections (e.g., including only payments for a selected condition that also used Medicare or Medicaid).
If you’re interest looking to filter your dataset to events that satisfy your criteria, you will need to download a hierarchical data extract that includes the condition identifier (i.e., ICD10CODE) and the payment identifier (EVEXPSRC). You will then need to link the condition record to the event record (see this user note for details) to drop events that do not satisfy your criteria.
2024-11-26 · General
The India Standard DHS 2005-06 (NFHS-3) contained an HIV testing component that necessitated scrambling of PSU numbers in order to preserve respondent confidentiality. As a result, IPUMS DHS did not create PSU-level measures. From reviewing the documentation, it is not clear to me whether this scrambling retained the same households within each PSU or whether households were scrambled across PSU. I recommend reaching out to the DHS Program to confirm the procedure used. In the former case, you may merge an IPUMS DHS extract with a data extract from the DHS program to add PSU identifiers to your observations and calculate these variables.
Would you be able to share the URL of where you obtained the screenshot from so that I can take a closer look? ROOMPPSU is not a variable that’s available on IPUMS DHS. A similar variable on IPUMS DHS, ROOMPPPSU, is not available for the India 2005 sample.
2024-11-26 · USA
You can use a vector of character values in order to specify a range in case_selections without needing to list each individual value. For instance, to request cases 16-24 for AGE from IPUMS USA, you could specify your request as:
mi_extract <- define_extract_micro(
collection = "usa",
description = "USA extract for Michigan",
samples = "us2022c",
variables = list(
var_spec("STATEFIP", case_selections = "26"),
var_spec("AGE", case_selections = as.character(16:24)))
)
2024-11-22 · International
We are interested in releasing the 2022 Zambia census, but do not currently have these data or a timeline for acquiring them. We appreciate your interest since it helps the team determine which samples to prioritize.
2024-11-22 · CPS
It’s difficult for me to say if the differences that you’re finding are due to differing survey methodologies or if you’re comparing different sources or levels of income. Since IPUMS does not provide data from the CES, my knowledge of this survey is limited. This page that compares the two data sources notes that “deviations between the two products are directly attributed to coverage, definitional, and measurement differences. Beyond that, time period differences between the two surveys may also account for some of the difference.” You may also find this introduction to CES tables helpful.
One significant difference in methodologies is that the CES tables report estimates using characteristics based on either the consumer unit or the reference person. The CPS meanwhile reports income for each person (INCTOT), family (FTOTVAL), and household (HHINCOME). Please also note that the CPS reports multiple different sources of income besides wages and salaries. Each of these sources is provided in a separate variable (see the full list of income variables).
Additionally, to protect respondent confidentiality, the Census Bureau engages in rank proximity swapping and applies a maximum value (top code) to each income variable. While this will likely not change the median value for income, this is something to still keep in mind when comparing your results.
2024-11-22 · General
I’m not aware of the methods used in the NYC Board of Education report, however I can discuss a few reasons their findings may be different from what’s available through the ACS:
- The statistic states that one of every 8 students was homeless at some point during the last year, however residence in the ACS is recorded only once at the time of interview. A smaller fraction of people will be homeless at any particular point in time than at some point during the year.
- While the ACS surveys facilities for people experiencing homelessness, it excludes certain GQ types such as domestic violence shelters, targeted non-sheltered outdoor locations, and dangerous encampments due to concerns about privacy and operational feasibility (see the ACS design and methodology report for more details). It may be that homeless students in NYC are more likely to reside in the latter group, or even in places that do not have a physical address such as a parked car.
- Respondents in group quarters are sampled using a roster of residents. However, if a homeless student is at the shelter for a short period of time then the roster might miss them (even though all residents of a sampled GQ should be included regardless of their length of stay) or they may leave the facility before completing the survey.
2024-11-22 · USA
We do not currently provide any additional documentation on the crosswalk file, however I’m happy to answer any specific questions that you have regarding it either on this forum post or through email at ipums@umn.edu. We will consider adding more documentation for this in the future.
2024-11-20 · General
According to the IRS, independent contractors and gig workers are considered to be self-employed workers and report business income and deductions on Schedule C of their 1040 form, making them small business owners. While the majority operate non-incorporated businesses, some may incorporate their business as a limited liability company (LLC). Owners of incorporated businesses can be distinguished from owners of non-incorporated businesses using the detailed codes for CLASSWRK (ACS)/CLASSWKR (CPS), however this variable groups independent contractors and gig workers together with other small business owners (i.e., sole proprietorships) into CLASSWKRD = 13. You might be able to make some assumptions about whether a person is an independent contractor or a sole proprietor by examining their reported occupation (OCC) and reported industry (IND).
Using PAIDEMP1 (have paid employees) makes it easier to separate independent contractors and gig workers from other non-incorporated business owners since the former are less likely to have any employees. However, you should keep in mind that some sole proprietorships do not have any employees and that some independent contractors may choose to hire their own employees.
With that said, there is a significant difference between the ACS and CPS that can affect the accuracy of responses. The ACS is a self-administered survey, which allows respondents to interpret questions in a way that’s different from the official tax/legal framework. The CPS however includes an in-person component where interviewers may provide respondents additional context if they are unsure about a response.
2024-11-20 · General · marked as solution
The homeownership rate data series that I’m finding on FRED reports the proportion of households, rather than families (or family householders) who own their own home. A Household includes all individuals who reside at a given address, regardless of their relation to each other, whereas a family consists of those related to each other by birth, marriage or adoption (see the Census families and households glossary). Households are identified in each IPUMS CPS sample with the variable SERIAL and individual families are enumerated within households using FAMUNIT. While 95%+ of households in the 2024 ASEC consist of either a single individual or a single family (i.e., where all household members are in the same FAMUNIT), some households contain multiple families and/or unrelated individuals. As a result, the national homeownership rate for families will not be the same as the homeownership rate for households.
I would also not expect the homeownership rate for family householders to equal the homeownership rate for families. Each household includes a single householder that is identified with PERNUM = 1. Typically, the householder is someone in whose name the housing unit is owned or rented under, however in the absence of such a person residing at the address, any adult can be identified as the householder. A family householder (identified using PERNUM =1 & FAMREL = 1) is then a type of householder who resides with relatives. However, secondary families that reside with other families in the same household do not include a family householder since only one individual per household can be the householder. Your measure also excludes non-family householders (PERNUM = 1 & FAMREL = 0) who do not reside with any relatives. An analysis of the 2024 ASEC shows that family householders are about 50% more likely to own their own home when compared to those who do not live with any relatives. When including both types, I find that 67% of householders in the 2024 ASEC reported owning their own home.
You can follow the outline below to determine the correct weight to use:
- If you are interested in studying householders (e.g., the percent of family householders who own their own home), then you should use the person-level weight ASECWT.
- The family weight ASECFWT should be used for analyses of families (e.g., the percent of families that own their own home). However, to properly analyze families, you will need to restrict your analysis to a single person per family.
- The household weight ASECWTH should be used for analyses of households (e.g., the percent of households that own their own home). As in the case of analyses of families, you should restrict your analysis to a single person per household (commonly to people with PERNUM = 1).
For incorporating weights into your analysis, I recommend reviewing our data training exercises which provide sample questions and code for producing weighted estimates. We recommend using one of our supported stats packages (Stata, SAS, SPSS, or R) or our online analysis tool for correctly applying weights to your sample.
2024-11-15 · Health Surveys
While we don’t currently offer the supplemental income files for these earlier years, we may in the future. I am in conversation with our IPUMS NHIS team about this and will follow up with you here if I have any more information to share.
2024-11-14 · USA
Whether to use household weights or person weights depends on the level of the statistic that you’re estimating. Household-level statistics (e.g., the percent of households with school age children) are those that describe households. For these, you should use household weights and restrict your analysis to a single person per household so that you count each household only once (typically done by restricting your sample to respondents with PERNUM = 1). The household weight appropriate for most household-level analyses of IPUMS USA data is HHWT.
You should be aware that the ACS does not ask participants to identify a household head. Rather, the first individual that participants list in their household roster is assigned PERNUM = 1. The only restriction is that this person must be someone under whose name the housing unit is owned or rented.
Person-level statistics (e.g., the average household income of persons with school age children) are those that describe people. For these, you should use person weights and include all people who satisfy your sampling criteria (i.e., if you only sampled persons aged 18+ you should restrict to respondents in the ACS who satisfy this criteria). The person weight appropriate for most person-level analyses of IPUMS data is PERWT.
Regarding YNGCH (age of youngest child) and ELDCH (age of oldest child), note that this identifies persons with children (biological, step-, or adopted) whose usual residence is the same household. These family interrelationship variables will not report the age of children who do not reside in the household.
2024-11-12 · CPS
While it is not common to drop repeated observations in analyses of CPS data, if your goal is to create a cross-sectional CPS ASEC sample then the procedure you outline makes sense to me. The IPUMS CPS team is exploring linking ASEC oversample respondents, but this capability is currently not available.
In terms of your analysis, the oversample group that you should be most aware of are Hispanic oversample respondents. As detailed in the technical write-up by Flood and Pascas, the CPS ASEC includes two oversample groups: the Hispanic oversample (1976-onwards), and the State Children’s Health Insurance Program (SCHIP) oversample (2002-onwards). The two methods of selecting SCHIP oversample respondents, as outlined in the linked paper, both ensure that these respondents are only included in a single ASEC sample. However, such a restriction does not exist for Hispanic oversample participants. These participants are drawn from additional interviews with November households (from the previous year) that contain one or more persons of Hispanic origin. The rotation pattern ensures that a household that was interviewed in November in one year will be interviewed again in November of the following year. As a result, Hispanic households interviewed in November can appear in two different ASEC oversamples. While the Hispanic oversample is much smaller than SCHIP, contributing about 5,500 households to the ASEC sample compared with about 16,000 for the SCHIP, identifying whether a Hispanic oversample respondent is in their first or second ASEC is challenging. I recommend reviewing this paper to better understand these challenges and potential solutions for linking oversample respondents.
There are a couple more things that you should be aware of:
- The CPS sample includes housing units (i.e., addresses) rather than households composed of specific people. This means that if a family moves while they are in the panel, they will not be interviewed further in the survey. If a new family moves into the unit, they will take the place of the old family. CPSIDV will not link these new respondents since they will fail the validation check, but you may want to retain both sets of families. To do so, you will want to retain all unique CPSIDV values in your dataset.
- As noted in the comparability tab for CPSIDP, linking between 1976 and 1977 is limited. The same restrictions noted on the tab apply to CPSIDV as well.
2024-11-11 · CPS
We definitely plan to release data for this supplement, but I don’t have a timeline at this point. I will share your interest with our data team, which prioritizes releases for frequently requested supplements.
If you need the data sooner, you may try downloading the unharmonized data directly from the Census Bureau. You can merge the data with an IPUMS extract using the linking keys HRHHID, HRHHID2, and LINENO (referred to as PULINENO in the CB data). However, you will want to make sure in this case that you’re referring to the Census codebook for any changes in the coding structure for your variables of interest. If you plan to do this linking, you should also be aware that data gathered for the Child Support Supplement, administered in April, are matched to the same individuals in the March ASEC file instead of being included in the April basic monthly sample. Therefore, you will want to merge the data with an IPUMS extract of the 2023 ASEC sample. See the IPUMS CPS supplement sample note for further details.
2024-11-11 · International · marked as solution
The department of residence for this sample is identified in the variable GEO1_CO2005 and the municipality is identified in GEO2_CO2005. It appears that all departments are represented in the data. Regarding municipalities, the comparability tab for GEO2_CO2005 notes that municipalities with populations less than 20,000 (based on 1993 counts) were regionalized (combined) with neighboring municipalities within the same department to create units with populations greater than 20,000. For example, residents of Ciudad Bolívar, Hispania, and Betania municipalities in Antioquia are all assigned the same code in GEO2_CO2005 (5008). All municipalities are represented in the sample, but they are not all identified individually because of the grouping together of smaller municipalities in the GEO2_CO2005 variable.
If you require identifying each individual municipality, then you might try to reach out to DANE to see if you can obtain more precise geographical identifiers. To use the IPUMS International microdata, you will have to either restrict your analysis to municipalities with 20,000+ inhabitants or aggregate your analysis to these regionalized units.
2024-11-07 · CPS
You can use INCTOT to calculate the percentage of total gross personal income an individual contributed to their retirement account. INCTOT combines all sources of pre-tax personal income or losses (see the comparability tab for INCTOT for a list of these sources over time). These sources include wage and business income, as well as income earned from interest (INCINT), dividends (INCDIVID), and other sources. If you want to calculate the rate as a percentage of wage/salary income, then INCWAGE is the correct variable to use. INCWAGE includes all wage/salary income earned from all jobs in the preceding calendar year, while INCLONGJ only includes income from the longest held job in the previous year.
A number of procedures are implemented to prevent the identification of individuals with high values for all income variables. The evolution of these procedures over time can be divided into traditional topcoding (1962-1995), replacement values (1996-2010), and rank proximity swapping (2011+) phases and is detailed in this IPUMS CPS user reference guide. These procedures will affect estimates of the contribution rates for affected individuals with incomes above these thresholds.
2024-11-06 · General
Data from 2019 NHIS Linked Mortality File (LMF), which links records of eligible deceased NHIS survey participants from 1986-2018 to records in the National Death Index (up to December 31, 2019), is available through IPUMS NHIS. The mortality variables page lists the variables from the file that are provided. You can find detailed notes about this public use data as well as the restricted file in the IPUMS NHIS user note on the LMF.
Once you’ve added the mortality variables you’re interested in, you can also add variables that report the participant’s marital status (MARSTCUR), their sex (SEX), and their reported sexual orientation (SEXORIEN, available from 2013-onwards). To obtain information on their partner’s sex, you can use the attach characteristics tool (available after adding samples and variables to your data cart, and clicking VIEW CART on the top right of the webpage). This tool allows you to attach one of the variables in your data cart as a characteristic of a person’s mother, father, or spouse. For example, using the variable SEX, it can make a new variable that report’s the participant’s spouse’s sex in a new variable called sex_sp. All persons in the extract who reside in a household with their spouse would receive a value for this new variable. Persons without a spouse present in the household would receive a missing value. The tool uses the constructed IPUMS family interrelationship pointer variable SPLOC, which accounts for same-sex and cohabiting couples. For more information, please see the IPUMS NHIS user note on family interrelationship variables. The note goes into detail about editing procedures for same-sex couples in the underlying data. In particular, analyses of same-sex couples in 2004 through the second quarter of 2007 using these data are discouraged. Analyses of same-sex couples prior to 1997 should note the limited documentation available about any potential editing.
Note that any variables that are not drawn from the National Death Index refer to data collected when the participant was interviewed for the NHIS survey and not at the time of death. This data will not report whether a person got divorced or married between the date of their NHIS interview and the date of their National Death Index record. Aside from the NHIS, you can also obtain data on respondents to the National Health and Nutrition Examination Survey (NHANES) linked to the National Death Index through the National Center for Health Statistics linkage information page.
2024-11-06 · USA
All ATUS weights are probability weights and should therefore be specified as pweights.
Regarding replicate weights, there are multiple equivalent methods for implementing these as survey design parameters, though these methods differ slightly between Stata and R. In Stata, you may specify the replicate weights as either BRR (as you do in your example) or as SDR (Successive Difference Replication) weights. Identical standard errors and confidence intervals can be obtained through either command when additional options are specified:
- For BRR, add the option fay(0.5)
- For SDR, add the option dof(159)
- For both BRR and SDR, add the option mse
For more information, see the svy variance estimation in Stata guide and section 7.5 of the ATUS user guide.
In R, you must specify the type as either “successive-difference” or “Fay” since “BRR” does not accept Fay’s adjustment. The option mse = TRUE should also be specified.
2024-11-05 · Time Use
You can find the documentation that describes each activity code (MAIN) in IPUMS AHTUS in the variable description tab by clicking on “additional documentation”. The childcare codes begin on page 31 and describe the types of activities included in each code across samples. For example, the documentation notes that medical care of children (MAIN = 35) includes the ATUS/BLS activities (ACTIVITY): providing medical care to household children (30301), obtaining medical care for household children (30302), as well as waiting associated with household children’s health (30303). You should be able to map these accordingly. One challenge is that coding “care of infants” and “general care of older children” requires combining the activity codes with the ages of children present during the activity (i.e., the same activity code in the ATUS will be coded differently in the AHTUS depending on if the activity was done with a child under 5 years old or with a child 5-17 years old). The documentation notes that both categories comprise of physical care for household children (ACTIVITY = 30101), organization and planning for household children (30108), looking after household children (30109), using paid childcare services (80101), and waiting associated with purchasing childcare services (80102). You can attach WHO records to your ATUS extract that provide information on who the respondent participated in a given activity with, using the variables RELATEW and AGEW.
Regarding weights, RECWGHT is the recommended weight to use for all of your analyses of AHTUS data for all sample years. However, you may choose to use ORIGWGHT (i.e., WT06 in AHTUS from 2003-onwards) instead. MTUS weights should be used only for analyses of MTUS data. RECWGHT recalibrates ATUS weights by assigning a weight of 0 to participants with low quality time diaries (LOWQUAL = 1). These are participants who recorded fewer than 7 activities, had more than 90 minutes missing from their time diary, or had time recorded in one or fewer of four basic activities (sleep or rest, eat or drink, personal care, and travel or exercise).
Some researchers may use RECWGHT to exclude these low quality diaries if they suspect that these diaries were inaccurately recorded and missing important details. For example, these diaries might be biased towards missing or underestimating time spent on caring for children. Note that since RECWGHT is recalibrated to represent the demographics of the US population after these diaries are excluded, simply dropping low quality diaries will not result in RECWGHT equaling ORIGWGHT. Alternatively, researchers might believe that low quality diaries are accurate (at least for their analyses), in which case they may use ORIGWGHT. In determining which weight to use, it may be worth examining the low quality cases further to determine the specific reason for exclusion, the types of activities the participant reported, and whether the participant resided in a household with a child.
2024-11-01 · Time Use
From a quick tabulation, I’m finding that the number of respondents with the top code for EARNWEEK (2884.61) increased from 202 in the 2003 ATUS to 442 in 2023 (from 1.5% to 8.2% of the total in-universe sample). As you explain, it is expected that more respondents will be top coded over time due to inflation. This may bias average earnings estimates by decreasing the reported earnings down to the top code for a growing size of the sample. It will in most cases not affect median earnings estimates since the median will still be below the top code threshold. The Census Bureau engaged with this issue in April 2023 when they instituted a dynamic topcode to weekly earnings that would be set at 3% of the sample in each survey month. This however does not address the issue for earlier samples.
You might be able to mitigate this effect by applying a consistent top code across your sample years and dropping respondents above this top code. For example, since EARNWEEK top codes at most 8.2% of respondents (in 2023), you might drop the top 8.2% of weekly earners from each sample that you analyze. Alternatively, if you’re interested in comparing inflation adjusted earnings, then you might observe that the top code value in 2023 is roughly equivalent to $1,752 in 2003. In this case, you might exclude respondents in each year whose inflation adjusted weekly earnings exceed the top code for your most recent year of analysis. A good strategy may be to perform your analysis with and without respondents with top-coded income values and compare your results.
For methods other than dropping top coded respondents, I recommend reviewing this paper on using the pareto distribution approach for top coded values. You will also want to review how other researchers and publications handle this issue.
2024-11-01 · Health Surveys
IPUMS MEPS hierarchical files nest condition records under the corresponding person record into a single file where person-level variables are reported on the person record (RECTYPE = P) and condition-level variables are reported on the condition record (RECTYPE = X). Phrased differently, person records are the parent to condition records. In the example below, copied from the IPUMS MEPS Extract Data Structures Guide, the condition-level variable ICD9CODE is provided on the condition record, which is nested under its “parent” person record with MEPSID = 2070001101 that it relates to. Since MEPSID is a person-level variable, it is missing for all condition-level records. Users can fill demographic variables on the person record down to the condition records they correspond to by replacing missing values for demographic variables with the preceding non-missing value.
While person records are parents to all other record types such that the hierarchical file nests all records relating to an individual under their person-record, this nesting does not repeat for other record types (except for linking records). For example, some condition records correspond to an event record, but they are not the child of the event record that they correspond to. Linking allows users to match these types of sibling records. Condition records can be linked to their event record sibling (if they have one) using the condition-event link record (RECTYPE = “J”) the follows the condition record. See the user guide for more information on condition-event linking.
Note that from 2018-onwards, condition records are only included if the condition is linked to an event such as a medical provider visit (see EVENTYPE for the types of events included), or a prescribed medicine obtained by the survey participant. Since this sampling procedure does not capture conditions that do not have an associated event or medication, MEPS condition data can be used to generate estimates of treated prevalence, but should not be used to make estimates of disease, prevalence of health conditions, or mortality/morbidity. From 1996-2017, the data additionally reports selected priority conditions such as cancer, diabetes, heart disease, and asthma (see PRTYCOND for more information on priority conditions) for all survey participants.
2024-10-31 · USA · marked as solution
Yes, COUNTYFIP = 0 is assigned to all households whose county of residence cannot be identified in the data. This code is used for households regardless of the state that they resided in (which is reported for all households in the variable STATEFIP).
To take the case of Texas, sampled households residing in one of 38 counties identified in the 2022 1-year ACS are assigned STATEFIP = 48 and the COUNTYFIP value associated with their county. Households that resided in one of the 216 unidentified counties are assigned STATEFIP = 48 and the COUNTYFIP = 0. For example, both Bastrop County and Caldwell County (part of the Austin metro area) are not identifiable and receive a COUNTYFIP code of 0 and a STATEFIP code of 48. Excluding persons in Texas with COUNTYFIP = 0 from your totals is equivalent to excluding all persons who reside in Bastrop, Caldwell, and the other unidentified counties in Texas from your total.
2024-10-25 · CPS
The approach you describe seems like the best option for identifying the most granular geography for each person in the CPS Voter Supplement. I’m finding that about 40% of respondents in the November 2022 supplement resided in one of 556 counties that are large enough to be identified on their own. Since metro areas are composed of one or more counties, there are many cases where the county of residence is not identified, but the metro area is. As an example, of those residing in unidentified counties in the November 2022 supplement, about 60% resided in one of 151 identified METFIPS metro areas.
The remainder of the population which resided in neither an identified county or metro area can be identified as residing in one of the 50 states. These respondents will typically be located in small rural counties in their state, however they can also include residents of smaller unidentified metro areas as well. You might use the variable METRO to further divide respondents within a state between metro and non-metro residents (i.e., METRO = 1 vs METRO = 2, 3, 4). Note that METRO = 0 (not identified) groups respondents both in unidentified metro areas and in non-metro areas; as a result, their metro status is indeterminate. INDIVIDCC is unlikely to give you much additional information since in most cases if a county is not identified then the individual city is also not identified.
With all of these tools in mind, you should be aware that the resulting small sample sizes for these granular geographical areas may add significant sampling error to your estimates. The Census Bureau specifically states that estimates for individual metropolitan areas “should be treated with caution. Although estimates for the larger areas such as New York, Los Angeles, and so forth, should be fairly accurate and valid for a multitude of uses, estimates for the smaller metropolitan areas (those with populations under 500,000) should be used with caution because of the relatively large sampling variability associated with these estimates.” Similar precaution should be taken with county-level estimates as well. One method you can use to be more informed about the sampling variability of your estimates is to calculate the standard error of your estimates by using the CPS supplement replicate weights. While you will need to download these separately since we currently do not provide them on IPUMS CPS, you can link the replicate weight observations with an IPUMS CPS extract using the linking keys HRHHID, HRHHID2, and LINENO (referred to as PULINENO in the CB data). Replicate weights allow a single sample to simulate a range of possible alternative samples, generating more informed standard error estimates that mimic the theoretical basis of standard errors while retaining all information about the complex sample design. See our user guide with sample code for running analyses using replicate weights.
As far as I’m aware, there are no county-level summary statistics published by the Census Bureau for the CPS Voter supplement. However, you can obtain education and income summary statistics on the county level through our spatial data project, IPUMS NHGIS. We recommend that new users of IPUMS NHGIS review the short video tutorials on the user guide as well as relevant portions of the FAQ page to familiarize themselves with the website.
2024-10-21 · CPS
The ASEC is a supplement to the March Basic Monthly Survey (BMS) that includes additional (oversample) respondents and questions that are not present in the March BMS. The supplement questions are fielded to all March BMS as well as oversample respondents, and oversample respondents are also administered the March BMS questionnaire. The ASEC sample file appends the new person/household records to the BMS and merges variables from each questionnaire onto a single record. As a result, the March BMS sample is a strict subset of the corresponding year’s ASEC sample on IPUMS CPS. Not only is it unnecessary to download extracts that contain both ASEC and March BMS data, but doing so will artificially inflate estimates as most person records (those not part of the oversample) will be included twice. This is the case for all CPS supplement data obtained through IPUMS CPS.
Regarding weights, person-level analyses of ASEC samples should use ASECWT, while person-level analysis of BMS data should use WTFINL. Analyses that use variables from both the BMS and a CPS supplement (such as the ASEC) should use the supplement’s weight since this corresponds to the stricter of the sample universes. Analyses of Outgoing Rotation Group variables should be weighted using EARNWT. Longitudinal weights should be used when linking records between multiple different months/years of the CPS. IPUMS provides both pre-constructed longitudinal weights (e.g., LNKFW1YWT for weighting linked ASEC samples from adjacent years) as well as guidance on weighting and sample code for creating your own longitudinal weights using iterative proportional fitting.
2024-10-18 · USA
You’re correct that the 2023 1-year microdata PUMS file was released by the Census Bureau yesterday (10/17/24). Now that the data are available we will work to ingest it into our system, though timing on when we release exactly can vary depending on how comparability between the new data and the older samples affects our harmonization process. Last year we published the 2022 ACS microdata sample via IPUMS USA in mid-November (see the IPUMS USA revision history for more details or dates of past 1-year ACS releases) and we expect the timeline to be similar this year.
We also plan to publish 2023 1-year ACS tabular summary data via IPUMS NHGIS in late November (see the IPUMS NHGIS revision history for more details of past 1-year ACS releases).
We will announce the releases promptly via the revision history pages and X (Twitter); we will also email IPUMS users when the data are available.
2024-10-17 · International
Using weights is necessary to produce estimates that are nationally representative (which you do in your second table). While the Colombia 2005 census data distributed by IPUMS International includes 10% of the records from the full census, this is not a random subsample of the full data. As mentioned in the sample characteristics page, the data was drawn from a stratified sample shared with IPUMS by the Colombia Departamento Administrativo Nacional de Estadística (DANE). As a result, persons and households with some characteristics are over-represented in the samples, while others are underrepresented. The documentation additionally notes that the census undercounted the population by an estimated 3.7%. Applying PERWT adjusts for this such that persons in the data are representative of the sample universe (alternatively, HHWT allows researchers to produce representative estimates for households).
2024-10-14 · General
The .xml DDI codebook is downloaded separately from the the compressed data file. To obtain the .xml file from the website, right-click the DDI link in the Codebook column from your My Data page, and select Save Link As… (see below).
Note that some browsers may display different text, but there should be an option to download the DDI file as .xml. (For instance, on Safari, select Download Linked File As….). You must save the file in .xml format, not .html format. You must also save the .xml file in the same folder as your .dat file. This vignette describes how to obtain IPUMS data using the website (as well as how to do so using our API).
You can then follow this vignette for instructions on how to input the data into R. To do so, you will need to download the ipumsr package. It can be installed using the following command:
install.packages('ipumsr')")
2024-10-12 · International
Sorry, I meant to say that there is no variable in the Mexico 2020 Census that distinguishes between formal and informal workers! Hope this information is helpful in figuring out how to best pursue your project.
2024-10-11 · International
There is no variable in the Mexico Labor Force Surveys that distinguishes between formal and informal workers. You might however be able to leverage details about a respondent’s class of worker status (see CLASSWK and its source variable MX2020A_CLASSWK) as well as other variables related to employment benefits such as MX2020A_LEAVEPAY (receives paid leave) and MX2020A_RETIRE (receives SAR retirement savings) to determine yourself whether a respondent is a formal or informal worker.
This International Monetary Fund Working Paper, written in collaboration with the Mexican National Institute of Statistics and Geography (INEGI), provides the following definition of informal workers:
An important feature of Mexican informality is that firms classified as formal employ a substantial share of workers in non-salaried informal contractual relationships. The definition of informal firms in this context includes subsistence agriculture, domestic work, and firms classified as informal by the Mexican National Institute of Statistics and Geography (INEGI) based on reported name, family ownership, and accounting practices. All other firms are classified as formal.
From the worker’s side, following criteria from INEGI, the definition of informal workers includes those at non-agricultural informal firms, self-employed agricultural workers, unpaid workers, non-salaried workers (at both formal and informal firms), and workers without access to social security health services in both formal and informal firms. Workers in non-salaried contractual relationships, including those at formal firms, are therefore included in the informal worker category. None of the workers under this definition have access to Mexican Social Security Institute (IMSS). All other workers are defined as formal.
2024-10-02 · International
EMPSTAT = 0 identifies persons who are not-in-universe (i.e., NIU) for the questions regarding employment status, meaning that the survey does not inquire into their employment status. The universe statement for EMPSTAT in the Mexico ENOE labor survey is present persons age 12+, indicating that the survey does not ask for the employment status of children under the age of 12 or for persons who do not reside in the household. Instead, these persons are assigned EMPSTAT = 0. When filtering records to those with AGE => 12 and RESIDENT = 1 (present resident), almost all records (99.9%+) will have a value for EMPSTAT > 0.
The ENOE is a rotating panel survey where each household is sampled five times over the course of five quarters. In the first interview, a household roster is created that lists every person who resided in the household at the time of the initial interview. Records for residents who are then noted as absent from the sampled household during any of the subsequent quarters are preserved in the data (these are the persons with RESIDENT = 2). However, their employment status is not recorded and instead set as NIU. There are a number of reasons someone might leave the household including moving in with a new partner, moving away from their previous partner, or passing away. You can tabulate the reasons any particular person left with the source variable MX2020H_CS_AD_MOT (reason for absence of habitual resident). You can also find the interview number (1-5) with the source variable MX2020H_N_ENT (interview number).
Leaving the household does not mean that the respondent is NILF, but only that they are no longer being sampled as part of the ENOE. You might treat those who left the household for work as being in the labor force and those who moved to study as leaving the labor force (although students can still be working). Aside from these cases and persons who have passed away, it is not possible to discern whether a non-resident is in the labor force or NILF. Additionally, none of the reasons for leaving the household specifically cite military service. I am also unable to find any variables that would identify respondents who are sampled while in military service.
2024-10-01 · International · marked as solution
Confirming whether your method correctly calculates the standard error is beyond the scope of the user support team. I can however direct you to the variables that you will need to implement the sampling error formula provided in section 3.9 of the documentation that you shared.
In the equation, e indexes the 32 states of Mexico (GEO1_MX), h indexes the design stratum (MX2020H_EST_D), and i indexes the Primary Sampling Unit (i.e., UPM). These sample design variables are provided by IPUMS International as source variables and can be found by selecting Source Variables from the top of the variable selector page. Source variables have not been harmonized across time; they are sample-specific and the corresponding variable for each quarter of the Mexico ENOE that you plan to analyze needs to be added to your data cart. The correct weight to use for person-level estimates is PERWT and the weight for household-level estimates is HHWT. Weights are referred to as expansion factors (factor de expansión) in the documentation.
2024-09-24 · USA · marked as solution
HHWT is constructed independently for each IPUMS USA sample. For 1960, IPUMS offers two samples for analysis: a 5% density sample and a 1% density sample. This is the case for many other decennial census years. The variable SAMPLE = 196001 identifies records in the 1960 1% and SAMPLE = 196002 identifies those in the 1960 5%.
In a sample that includes only household records (or only a single person record per household), the sum of HHWT across all records should equal to the number of households in the US population in that year. That means that the sum of HHWT in the 1960 5% and the 1960 1% samples will each approximate the total number of households in 1960. More detail on each sample can be found on our samples page and in the User Guide’s section on sample designs.
Using the code you provide, I obtained an estimate of 57,699,837 households using the 1960 1% sample. The 1960 5% sample meanwhile provides an estimate of 57,734,760 households. The sum of these two match the result that you’re reporting. I hope this clarifies what’s happening with the data.
2024-09-24 · CPS
You can also refer to this IPUMS blog post for more details on calculating alternative measures of unemployment published by the BLS using IPUMS CPS data.
2024-09-23 · CPS
A number of different unemployment metrics are published by the BLS and the specific procedure to replicate them will depend on a variety of factors. I am sharing some general guidelines as well as a procedure to replicate the values in the BLS table Employment status of the civilian noninstitutional population. This table provides estimates of the number of persons employed, unemployed, and not in the labor force averaged over each year. Unlike monthly data, which the BLS applies seasonal adjustment techniques to, this annual data does not require seasonal adjustment and is therefore more straightforward to generate using IPUMS CPS data. If you encounter any difficulties with the procedure below, please take a look at this short video tutorial of the IPUMS CPS extract system or our detailed FAQ page. We also provide data training exercises with questions and sample code that are helpful for confirming your understanding of how to correctly analyze IPUMS data.
Since the table reports annual averages, you will want to add all of the Basic Monthly Survey (BMS) samples for the years that you are interested in. From looking at the table, you’ll want the variables EMPSTAT (employment status), LABFORCE (labor force participation), and IND (respondent’s industry). Analysis of CPS data must use weights to make the estimates nationally representative and account for the complex sampling design. You should use COMPWT with analyses that are intended to replicate BLS estimates, so add COMPWT to your data cart.
Once you’ve added these samples and variables, you should request your data extract, download and decompress the file, and input it into your preferred statistical package (we offer syntax files for Stata, R, SAS, and SPSS and formatted files for Stata, SAS, SPSS, and Excel). Since each monthly sample is weighted to represent the sample universe (the US civilian non-institutionalized population 16 years of age and older) in that particular month, you need to divide COMPWT by 12 to obtain annual averages. Now you can tabulate your data by year to obtain counts of the sample universe, the labor force, the un/employed population, and the population not in the labor force, making sure to apply COMPWT as the survey sampling weight. Below I reproduce my estimates for 2020-2023 in Stata next to the estimates in the linked BLS table. While EMPSTAT provides more detailed employment categories, these can be easily summed to obtain the values from the table.
Note that PUMS CPS harmonizes and integrates the CPS PUMS (Public Use Microdata Sample) file, which differs slightly from the internal CPS microdata file used by the BLS for estimates. Specifically, respondents in the PUMS have their ages perturbed and some geographic identifiers are additionally synthesized to further protect confidentiality. As a result, while topside labor force estimates (such as the ones in this example) will continue to match published data, estimates below the topside level (e.g., employment status by age, sex, race, and ethnicity) are expected to differ slightly from the published data. All such differences should fall within the sampling variability associated with CPS estimates.
2024-09-19 · International
It appears that R cannot find the .dat data file. Please follow the steps below to read the data file correctly. You can refer to this ipumsr vignette if you are not sure about any of these steps.
-
Make sure the .dat data file and .xml codebook file are downloaded, the .dat file is decompressed (we recommend 7-zip for Windows users and The Unarchiver for Mac), and are in the same folder.
-
Set your working directory as the folder where these files are located:
setwd(“C:/enter/path/to/folder”)
- Run the following commands, where read_ipums_ddi() references the name of the codebook file in your working directory:
ddi ← read_ipums_ddi(“ipumsi_00005.xml”)
data ← read_ipums_micro(ddi)
2024-09-19 · USA
Glad you were able to resolve the immediate issue (even though it might have not given you the result that you were hoping). I can provide some additional information that may be useful.
The Census Bureau issued a new vintage of PUMA boundaries in 2022 that revised the boundaries used in samples from 2012-2021. You can see the changes in Chicago by overlaying the two PUMA vintages in this PUMA map. You can also view these changes in the 2010-2020 PUMA crosswalk file. Each observation in the file is an area of intersection between a 2010 vintage (2012-2021) and a 2020 vintage (2022-2031) PUMA. The file provides the estimated percent of each 2010 PUMA’s population and land area that corresponds to each 2020 PUMA. For example, you can see that 2010 PUMA 3408 (Cook County (Central)–Cicero, Berwyn & Oak Park Townships) was divided between two different 2020 PUMAs (3111 and 3112). About 26.96% of its population went to PUMA 3111 and 74.06% went to PUMA 3112.
If observing individual microdata records is not crucial for your analysis, you might instead obtain data from IPUMS NHGIS, which reports aggregate summary statistics for geographies (e.g., cities, counties, census tracts, etc.) with 65,000 or more inhabitants on an annual basis and for smaller areas on a 5-year basis (e.g., 2018-2022). We recommend that new IPUMS NHGIS users familiarize themselves with the website by reviewing the FAQ page and the relevant video tutorials on our User Guide.
2024-09-19 · USA
Social Security and Supplemental Security Income (SSI) are two different federal entitlement programs (see this factsheet for further details). INCSS reports Social Security income and Railroad Retirement benefits for railroad workers who do not participate in Social Security; it does not does not include SSI. Instead, INCSUPP is used to report SSI income in the ACS/PRCS samples as well as the 2000 census. The questionnaires in each of these samples include separate questions about Social Security and Supplemental Security Income. In the decennial census samples prior to 2000, SSI income is reported in INCWELFR.
2024-09-18 · USA
While both SNAP and TANF are federal programs, funding is allocated to US states who then distribute it to qualified recipients. As a result, both of these should be included by respondents in INCWELFR as public assistance received from state or local welfare offices. General Assistance refers to a specific welfare program offered in certain states and localities that benefits adults without dependents (see this report for more information about the availability of General Assistance across the US). Data for INCWELFR comes from self-administered survey and census data, so determining how to report different sources of income comes down to the judgement of individual respondents. You can see the questionnaire text and any additional instruction that was provided to respondents in the variable Questionnaire tab (add samples of interest to your data cart to see the instructions for those samples).
Aside from American Community Survey and decennial census data on IPUMS USA, public assistance income (INCWELFR) is also reported in the Current Population Survey on IPUMS CPS. The CPS interview is administered by a field representative who is provided additional training and documentation to classify various sources of income. This Bureau of Economic Analysis presentation describes some of the differences in income reporting between the ACS and CPS.
2024-09-18 · General
The Census Bureau tallies ancestry data somewhat differently from data on Hispanic origin and race. Appendix B (Definitions of Subject Characteristics) in the 2000 SF3 Technical Documentation directly discusses this process:
Also, the [ancestry] question was intended to provide data for groups that were not included in the Hispanic origin and race questions. Official Hispanic origin data come from long-form
questionnaire Item 5, and official race data come from long-form questionnaire Item 6.
Therefore, although data on all groups are collected, the ancestry data shown in these
tabulations are for non-Hispanic and nonrace groups. Hispanic and race groups are included
in the ‘‘Other groups’’ category for the ancestry tables in these tabulations.
You can also refer to the technical documentation for the other decennial summary files and the ACS Subject Definitions for more information about each dataset.
For data on peoples with Mexican origin or descent, you will want to select Hispanic Origin from the topics menu. This is a separate topic due to the large amount of data tables pertaining to this demographic group.
Your question on the ancestry of African Americans is more complicated; many Black Americans do not have detailed knowledge of their ethnic ancestry due to the history of forced migration and enslavement. As a result, respondents in this group may provide only a broad origin (e.g., Sub-Saharan African) or in other cases choose to identify as African-American as their ancestry (or report no ancestry at all). For example, see this Census Bureau post which notes that “over half of all Black respondents wrote in African American as their detailed identity”. Also, note that there may be systematic differences between Black Americans who provide more detailed and less detailed ancestry responses (e.g., immigrant status).
With that said, there are tables that provide reported ancestries originating in Africa in 2000, 2008-2012, and 2018-2022. For 2000, the table NPCT016C Population that Reported First Ancestry by Selected Detailed Ancestry (from the 2000_SF3a dataset) provides counts for a number of ethnicities originating in Africa (see screenshot below) These ethnicities are also provided in the ACS 5-year tables that I mentioned in my previous response .
2024-09-13 · General
As a result of the confidentiality protections implemented in the data by the Census Bureau, the public use microdata samples from 1950-onwards that IPUMS USA harmonizes do not provide the county of residence for all respondents. On the other hand, data tables on IPUMS NHGIS are able to provide statistics for all counties and congressional districts since they aggregate individual records by geographic location.
County and congressional district level data on reported ancestry is available in the decennial census and American Community Survey (ACS) datasets on IPUMS NHGIS from 1980-2020. From 1980-2000, the ancestry question is available through the main decennial census files. After 2000, this question moved to the ACS, which was designed to be an annual longform supplement to the Census. Data from the ACS is released in single year and 5-year summary datasets; as you might expect, the 5-year file provides estimates using five years of ACS data. Data for each single year is available only for areas with at least 65,000 residents. Most counties are smaller than that, so to get data for all counties after 2000, you should use ACS 5-year data. To find these datasets, you should select 5-year ranges as your year filter (i.e., 2008-2012 for 2010 and 2018-2022 for 2020) for county data, though you can use the 1-year ACS data for congressional district level tables. For county-level data tables on ancestry, see table NTPA15 in the 1980_STF4Pa dataset (125 ancestry categories reported), NPA21 in 1990_STF4a (106 different ancestries), NPCT018B in 2000_SF3a (71 ancestries), B04003 in 2008_2012_ACS5b (107 ancestries), and B04006 in 2018_2022_ACS5b (108 ancestries).
While the aggregated data allows the Census Bureau to release statistics for all counties/districts, there are still instances when reported categories need to be aggregated themselves due to small samples that risk compromising respondent confidentiality. This is why you might not see reported ancestries for each South American country, but instead an aggregate all other Central and South American and/or Carribean group. For example, in the 1980 data I am seeing separate Brazilian and Guyanese ancestry groups, and then an Other Caribbean, Central and South American group. Ancestries are also a complicated topic and not necessarily tied to country of origin; an Argentinian in the US might provide their ancestry as German or Italian even if they were originally born in Argentina (the topic filter Nativity and Place of Birth on IPUMS NHGIS can provide more tables on this). You will also want to determine if you want to analyze respondents based on their first reported ancestry or based on all of their reported ancestries since different tables are available for each.
2024-09-11 · General
You can match siblings in each household by using the IPUMS constructed family interrelationship variables MOMLOC and POPLOC. Households are uniquely identified within each Census year with a SERIAL number; since SERIAL values are reused across years, they must be used together with the variable SAMPLE to identify households when pooling multiple years of data. Within each unique combination of SERIAL and SAMPLE, individuals with the same values for MOMLOC and/or POPLOC are inferred by IPUMS as being siblings.
The original Census data only indicates the relationship of each household member to the household head without providing information on the relationships between individuals who are not the household head. As a result, IPUMS creates family interrelationship variables to simplify the process of linking family members for users. You can read about our linking method in detail on the Family Interrelationships User Guide.These variables include MOMLOC, which reports the person number (PERNUM) of the individual’s probable mother, and POPLOC, with the same for the individual’s probable father. This type of linking is only possible if the individual’s parent resides in the same household and cannot identify parents who are not recorded in the household roster. In cases where there is no mother/father to link to, our algorithm assigns a value of 0 for the corresponding variable. While there is no age limit for an individual to be linked to their co-resident parents (i.e., adult siblings living with their parents will still be identified), this method works best for matching younger siblings since it misses siblings who live together without their parents or whose parents have died. MOMLOC/POPLOC includes social relationships (such as stepfather and adoptive father) as well as biological relationships; STEPMOM/STEPPOP can be used to additionally differentiate between these cases. The rule used for a link between a parent and a child is provided in MOMRULE_HIST and POPRULE_HIST.
The attach characteristics tool allows users to add variables pertaining to an individual’s mother/father (as well as spouse and household head) as an additional variable on the individual’s record. For example, you can use the tool to add the variables OCCSCORE_MOM and OCCSCORE_POP, which will provide the OCCSCORE value for each person’s mother and father as identified in MOMLOC/POPLOC. This option is available on the Extract Options page after clicking View on your data cart and proceeding to create your extract. Only variables that have already been added to your data cart will appear as options in the attach characteristics tool. OCCSCORE_MOM/OCCSCORE_POP will be missing if there is no corresponding parent record to link to.
Currently, only 10-year links are available through the IPUMS USA extract system. Based on your description of wanting to link 1910 to 1940 directly, I recommend using the 30-year links through the MLP version 1.2 crosswalks. These crosswalks link HISTIDs (a consistent individual-level identifier) across full count samples by assigning linked records the same HIK. This allows you to sequentially merge each separate 1910 and 1940 data extract with the variables that you requested onto the crosswalk to obtain your linked data. For this method, do not utilize the “link census data” feature on the website. Please see this user guide for further details and sample code.
2024-09-06 · USA · marked as solution
The historical data team has identified a number of additional counties besides Miami-Dade whose SEA code in certain census years does not correspond to the code in our documentation. We will work to correct these codes and will note the fix on the IPUMS USA revision history page when it is released. In the meantime, I’m attaching a file that lists the correct State-County-SEA mappings for misassigned counties with an additional column that indicates the census year the SEA code is misassigned.
Thank you for bringing this issue to our attention. We like to show our appreciation for users who help us significantly improve the data by offering them an IPUMS mug as a token of our gratitude. Please send an email to us at ipums@umn.edu with an address that we can ship your mug to.
miscoded_sea_dict.xlsx (15.0 KB)
2024-09-06 · USA
Thank you for bringing this issue to our attention. We have re-released data for 5 variables (CITY, MET2013, MET2023, MIGMET131, PWMET13) to improve the identification of a number of corresponding geographic areas. We have also updated CITYPOP and five “mismatch error” variables (CITYERR, MET2013ERR, MET2023ERR, MIGMET13ERR, PWMET13ERR) with corresponding revisions.
Users who previously downloaded any of these variables in a data extract with either the 2022 ACS 1-year or 5-year samples should resubmit their extract request(s) to obtain the corrected data. More information about this revision and the areas that it affects can be found in the September 4, 2024 revision history note.
2024-09-06 · General
A top code is assigned to all respondents whose income is above a certain threshold. This is done on a variable-by-variable basis such that a respondent might have a top code assigned for wage income (INCWAGE), but not for investment income (INCINVST). In the ACS samples, this threshold is set at the 99.5th percentile in each state, since outlier income values might be used to identify survey respondents. The top code for each income source variable is the state mean of values above the threshold value. A similar procedure is used for bottom coding for income sources that are allowed to be negative, including business and farm income (INCBUS00), investment income (INCINVST), and other income (INCOTHER). Retaining these observations should not pose issues for calculating medians since only the top 0.5% of earners receive a top code and the medians that you calculate will likely be below this threshold; entirely omitting these households however would skew the results.
There are two additional complications that you should be aware of:
-
Household income is not directly reported in the ACS. HHINCOME is created by summing the values of INCTOT (total personal income) for all household members. INCTOT itself is the sum of eight different sources of income (see the comparability tab for INCTOT for the list of variables). While neither HHINCOME nor INCTOT are top coded, the individual components of INCTOT are. Note that HHINCOME = 9999999 are not-in-universe values assigned to group quarters and vacant unit respondents; these should be dropped from your median calculation.
-
While the Boston metro area is identified by MET2013 = 14460, a small number of respondents who are coded as residing in this metro area are adjacent to, but outside the metro. The Public Use Microdata Sample (PUMS) file released by the Census Bureau only identifies the State and Public Use Microdata Area (PUMA) of respondent households; IPUMS USA harmonizes this data to allow users to analyze metropolitan areas where the discrepancy between PUMA and metro boundaries is determined to be sufficiently low. You can find a detailed explanation of our protocol in the description tab for MET2013 and an estimate of the number of miscoded cases in the match summary file.
If having access to the microdata person-level records is not crucial for your analysis, I recommend obtaining the median household income data from IPUMS NHGIS. This IPUMS project also releases ACS data, but instead of harmonizing the person-level PUMS file, the project allows researchers to access summary statistics from the ACS published by the Census Bureau. By selecting Household and Family Income as a topic in the Data Finder tool, you can find tables that report the median household income for a variety of geographic areas including metro areas. Since these are summary statistics generated by Census from an internal file, there are no top codes or misidentified households. We recommend that new users of IPUMS NHGIS familiarize themselves with the website by reviewing the FAQ page and the short video tutorials in the User Guide.
2024-09-06 · CPS · marked as solution
While IPUMS CPS provides many of the variables from the Tobacco Use Supplement, we do not currently offer the variables on nicotine pouches. I will share your interest in these variables with our IPUMS CPS team, who considers user needs and requests when prioritizing the addition of data to our platform. We note any new variables that are added to the database on the revision history page.
In the meantime, you might link this data from respondents in the Census Bureau file to an IPUMS CPS extract using the variables HRHHID, HRHHID2, and PULINENO (LINENO in IPUMS) as linking keys.
2024-08-27 · USA
You are correct that the CPS asks respondents who are not in the labor force whether they want a job each month as part of the Basic Monthly Survey (BMS); however, currently IPUMS CPS has only harmonized the ASEC samples for this question in the variable WANTJOB (see the availability tab for WANTJOB). Since the ASEC is fielded in March of each year, WANTJOB cannot be used to replicate estimates for any other months (such as the July estimates in the table you link).
However, the responses to this question in the BMS are available in the unharmonized variable UH_NLFWANT_B1, which corresponds to the original CPS variable PRWNTJOB (see the 2024 CPS BMS codebook). Similarly, the unharmonized variable UH_LOOK12_B1 corresponding to the original CPS variable PEDWLKO records whether the respondent looked for work at any time in the past 12 months. When using unharmonized CPS variables, users should review documentation from the Bureau of Labor Statistics (such as the codebooks) for key information like the codes and universes for the variable as well as any changes to these variables over time that may affect their analysis. I will suggest to the IPUMS CPS team that expanding WANTJOB to include BMS samples would be useful.
Note that when replicating month-to-month published BLS labor force estimates, you will also want to use the person-level weight COMPWT. When tabulating weighted observations by UH_NLFWANT_B1, I obtained an estimate of 5,581,570 persons who Want a Job in July 2023 and 5,959,261 such persons in 2024 (see screenshot from a tabulation using Stata below). These estimates are within a few thousand of the ones in the linked tables. Researchers should expect some discrepancy within the estimate’s margin of error since the public use microdata file that IPUMS CPS obtains contains perturbations in the data that protect respondent confidentiality. There may also be additional criteria used to calculate this statistic by the BLS that I am not aware of. The note regarding passive jobseekers appears to simply indicate that the true number of persons who want a job is not obtainable using CPS data because the survey doesn’t ask every respondent whether they wanted a job and hence misses some groups such as passive jobseekers.
2024-08-20 · CPS · marked as solution
CPSIDV is a variable created by IPUMS CPS that uniquely identifies individuals across CPS samples using consistent values of AGE, SEX, and RACE to validate links. CPSIDV will not link individuals who appear to not be the same person across samples. Since the CPS samples housing units (i.e., dwellings) rather than following individual persons, this limits false links when people move or otherwise leave the CPS sample (unlike CPSIDP).
Could you share how you created the variable minsamp since IPUMS CPS does not have such a variable? This might help me provide a more targeted response. I assume that minisamp is derived from the variable MISH, which indicates the number of times occupants of a housing unit (i.e., dwelling) have been interviewed for the CPS up to that survey month. However, this is not the same as the number of times a particular individual is identified using CPSIDV since individuals living in the sampled dwelling may change during the CPS observation period.
For example, a person who moves into the unit between interviews is assigned the MISH value for their housing unit for the following interview round. Someone who moves into the housing unit between the unit’s seventh and eighth month-in-sample will be assigned MISH = 8 in the following interview, reflecting that this is the unit’s eighth interview. Similarly, an entire family might move out from their house between their seventh and eighth month-in-sample while another family moves in. Since the CPS samples housing units rather than following individual persons, the family will replace the old family for the housing unit’s remaining CPS panel rounds. In both cases, CPSIDV should not link the person to any prior records since they only appear in the CPS for their housing unit’s eighth month-in-sample. There are additional cases where it is not possible or practical to link respondents across the panel due to a lack of documentation (see Extending Current Population Survey Linkages: Obstacles and Solutions for Linking Monthly Data from 1976 to 1988 by Flood et al.).
The IPUMS Working paper that describes CPSIDV, A Holistic Approach to Validating Current Population Survey Panel Data (Rodgers & Flood, 2023), states that “the first time an individual is observed in the CPS (MISH=1 or the first instance of CPSIDP) a unique CPSIDV is assigned to them.” The individual that is identified by the CPSIDV value that you shared is only observed in the CPS panel once (in September 1991). They are assigned these first six digits to denote the month and year that they were first observed in the panel.
2024-08-20 · Global Health
The correct svyset command for estimates will depend on that particular survey’s sampling method and the specific analysis that you want to run. Generally, the correct strata variable to use with IPUMS MICS is IMICSSTRATUM and the correct PSU variable is IMICSPSU; both are available for the Argentina 2019 sample on the household characteristics unit of analysis record. This Linking Guide explains how to merge the data from the household characteristics unit (HH) onto the files with child and household member records.
Since the primary sampling unit is generally the same as the sampling cluster, IMICSCLUSTER can be used in place of IMICSPSU when the latter is unavailable. Note that IMICSSTRUM is identical to STRATUM except in that it combines the unique sample identifier SAMPLE such that the strata values are unique even when you have pooled multiple samples together. The same is true for IMICSPSU/PSU and IMICSCLUSTER/CLUSTER. I am not finding any documentation suggesting to use HH6 (URBAN) for your strata. The Designing and Selecting the Sample guide available on the MICS4 tools page might be helpful in familiarizing yourself with the general sampling procedure for the MICS surveys.
2024-08-19 · CPS
The flag variable for GOTWIC (QGOTWIC) provides additional information by identifying respondents whose value for GOTWIC was allocated by Census Bureau enumerators due to missing or contradictory data. The presence of a flag variable does not imply that there are widespread or systematic quality issues with a variable. From a quick cross tabulation, I’m finding that about 7% of respondents to the 2023 ASEC were allocated a value for GOTWIC, with the vast majority being assigned a value of 1 (“no”).
More broadly, GOTWIC and SPMWIC measure different things. GOTWIC identifies pregnant women and mothers who received WIC benefits (all boys/men receive a code of GOTWIC = 0), regardless of whether they themselves qualified or their child under 5 years of age did. While you might find a few stray cases in each sample year of children with GOTWIC = 2 (yes), these appear to be coding errors by enumerators misattributing the mother’s WIC benefits to her children. SPMWIC meanwhile assigns the total value of WIC benefits received by members of an SPM family unit to all members of that family (see SPMFAMUNIT for more information on how supplemental poverty measure family units are defined). Since SPMWIC assigns positive values to the young children of mothers who earn WIC benefits, it makes sense to use SPMWIC in your analysis of children.
It is possible to calculate income-to-poverty ratios for families individually in order to identify those at or above 185% of the federal poverty threshold. OFFTOTVAL reports the total family income and OFFCUTOFF provides the poverty line threshold. Dividing the former by the latter should allow you to identify the percentage of the family’s income relative to the threshold. This method is specifically for generating official poverty estimates rather than the supplemental poverty measure (SPMPOV). You can find more information on how IPUMS CPS worked with the Census Bureau to offer these variables for reproducing official poverty estimates in the Official Poverty Rates Using IPUMS CPS Guide.
2024-08-14 · General
The 2018 Nigeria DHS substituted the DPT vaccination question with the Pentavalent vaccination, which includes a vaccination against diphtheria, pertussis, and tetanus, as well as hepatitis B, and Haemophilus influenzae type b. Below is a comparison of the 2013 and the 2018 child immunization questions. You can find the data for these questions in the variables VACPENTA1, VACPENTA2, and VACPENTA3. The day, month, and year that the vaccination was administered is also recorded in additional variables available in the DPT-HB-Hib vaccinations variables list.
Link to 2013 Questionnaire

Link to 2018 Questionnaire
2024-08-13 · USA
I reviewed your data extracts and it appears that you requested an extract with two 1990 samples (5% state and 1% metro) and two 2000 samples (5% and 1%). Each of the weighted samples is intended to represent the US population, so an extract that includes two samples would result in counts that are about twice the actual values. When grouping cases by SAMPLE rather than YEAR, the sum of PERWT for Michigan respondents is about 9.3 million for each of the 1990 samples and 9.9 million for the 2000 samples. I hope this solves the issue that you’re encountering.
2024-08-12 · General
I am not aware of any official guidance from the Census Bureau for such an analysis, but I can share some guidelines on using these longitudinal weights.
WTFINL is used to weight respondents in a single or in multiple pooled basic monthly surveys in order for the sample(s) to be representative of the US noninstitutional population as a whole. The weight is based on the inverse probability of selection into the sample (and a few additional adjustments). When analyzing a linked sample however, you are correct that the linking weights should be used in order to maintain representativeness. This is because the sample of respondents who are linked between two months (e.g., January and February 2024) are not selected with the same probability as the combination of respondents who are sampled in either of the two months. LNKFW1MWT is created by IPUMS for each sample of respondents who link across adjacent months by adjusting the WTFINL values using iterative proportional fitting (ipf) or raking of the new linked sample based on intersections of a set of demographic and geographic variables. Based on the description of your research question, your weighting strategy using LNKFW1MWT and LNKFW45WT seems correct to me.
However, your strategy using LNKFWMIS14WT and LNKFWMIS58WT needs to be modified. LNKFWMIS14WT is created by raking the sample of respondents who link across all four of their first months in sample (MISH). It represents the inverse probability of linking across all four of these months. As a result, it is incorrect to use this weight for a transition with an origin in MISH 1 and a destination in MISH 4. It will also equal 0 for respondents who are not linked across these months in the sample. Therefore, you will need to create your own linking weights for the links that are not covered by LNKFW1MWT and LNKFW45WT (e.g., MISH 1 to MISH 4). In the Weighting Linked Datasets section, we provide Stata replication files that you can use to create your own linking weights. I also strongly recommend reviewing what other researchers in the literature have done before creating your own weights to determine if this is the method that you want to pursue for your project.
2024-08-07 · CPS · marked as solution
IPUMS assigns households to METRO = 0 in cases when the Census Bureau does not disclose whether a household resided in a metro or non-metro area (i.e., cases where the unharmonized variable UH_METSTAT_A1 or UH_METSTAT_B1 = 3). These households therefore cannot be categorized either as residing in a metro area or non-metro area and may include both types of households.
In order to protect respondent confidentiality, the Census Bureau uses internal population thresholds to determine which metro areas (METFIPS) can be identified in the data and which are too small to do so. In the case of Colorado, all six metro areas based on the June 30, 1993, MSAs are identified in the ASEC from 1995-2004. From 2005-2014, the ASEC used the June 2003 MSAs (now called CBSAs) delineated by the Office of Management and Budget. The set of Colorado MSAs in the June 2003 delineation includes a single metro area (Grand Junction) that did not meet the threshold for identification in METFIPS. It additionally appears to not have met the threshold for identification for METRO; by being the only unidentified metro in the state, households in this metro could not have been coded into METRO = 2, 3, or 4 since it would be trivial to identify which metro these respondents came from. Moreover, assigning these respondents to METRO = 0 as the only households in this category would also not address this concern. The METRO = 0 category needed to be supplemented by respondents not in metro areas, which is why we cannot identify respondents from non-metro areas in the state from 2006-2014.
From 2015-present, the ASEC does not identify two metro areas in Colorado: Grand Junction and Pueblo. However, there are no respondents with METRO = 0 and all respondents with an unidentified METFIPS (99998) are coded with METRO = 1. It appears therefore that neither of these metro areas were sampled from 2015-onwards. You can read more about the CPS sample design in Chapter 2-2 of the Design and Methodology Technical Paper 77. In particular, the paper notes that while each MSA forms its own primary sampling unit (PSU), not every PSU is selected for inclusion in the sample. Note that since there are no respondents with METRO = 0, there is no need to supplement this category with respondents with METRO = 1 and non-metro respondents can be identified in this period.
You’ll notice that the transition between these periods is not perfect; there are observations across all METRO categories in 2005 and 2015. These respondents are from the ASEC Hispanic oversample and are sampled separately using the preceding period’s sampling procedure.
2024-08-07 · USA
You are correct that the combination of SAMPLE and SERIAL uniquely identifies each household in the data, but there should not be any household records with duplicate combinations of SAMPLE and SERIAL that make this line of code necessary. Duplicate combinations of SAMPLE and SERIAL would come only from a person-level extract, while duplicate values of SERIAL (alone) could come from an extract at the household-level that pools together multiple samples.
With a household-records only extract of the 2022 5-year ACS data for California PUMA 00101, I find 3490 households with HHINCOME != 9999999. Running distinct(data, SAMPLE, SERIAL) afterwards does not change my data. If you are seeing duplicate combinations of SAMPLE and SERIAL, then you likely have person-level records in your data (see RECTYPE) .
2024-07-31 · USA
IPUMS USA provides census and survey microdata where each record is a single respondent person or household. If you are looking for county-level statistics, then the geographically aggregated summary data on IPUMS NHGIS may be a better fit.
The county of residence for respondent households is not directly identified in the microdata from 1950-onwards due to concerns regarding respondent confidentiality. IPUMS identifies the county of residence in the variable COUNTYFIP using publicly available geography identifiers (see PUMA). However, as the description tab for COUNTYFIP notes, only certain counties can be identified in the data from 1950-onwards and the tab includes an Identified Counties sheet that documents which counties are identified in what samples. Hawaii and Honolulu counties are the only counties in the state that can be identified in this period; at least one of them is available in all samples from 1950-onwards except the 1950 1% sample, the 1960 1% metro samples, and the 2000 1% sample. Both counties are identified in ACS data from 2005-onwards.
I took a look at your recent extracts and noticed that you requested the data in .csv format. Due to the size and complexity of the microdata, we recommend that users analyze the data using a statistics package (IPUMS provides support for Stata, R, SAS, and SPSS). A significant limitation of Excel is its row limit of 1,048,576; Excel will not display any rows beyond this even if there are additional records in the data. For comparison, each of the 1-year ACS files contain approximately 3 million person records.
If you want to continue with Excel, you can use the Select Cases feature (see screenshot below) to request an extract that only includes cases from Hawaii (which will fit within the row limit). This option is available after submitting your data cart, but before submitting your extract. If you have access to a stats package such as Stata, R, SPSS, or SAS, we highly recommend using one of these to analyze your data since they do not have a set row limit and provide additional tools for analysis. Otherwise, we also provide an online analysis tool that can run simple analyses in place of a stats package. We highly recommend that new users practice analyzing the data using the online tool or a stats package with our detailed data training exercises.
2024-07-29 · USA
While we are currently investigating concerns regarding some MET2013 areas in the 2022 files (specifically those that are identified with a commission/omission error), the San Diego metro area is coded correctly using the 22 PUMAs that are all fully contained within the metro area. You can find the list of PUMAs that compose each metro area in the Crosswalk Between 2013 MSAs and 2020 PUMAs document on the resource page that Jonathan linked to. A tabulation of the data confirms that all of these PUMAs are correctly coded with MET2013 = 41740.
I suspect the issue you are encountering is that the codes for PUMAs change over different vintages; PUMAs are updated following each decennial census, creating a new vintage of PUMAs that may use codes from the previous vintage but associate them with a different PUMA. For example, PUMAs 7303, 7304, and 7305 (in STATEFIP = 6) were part of the San Diego metro area in 2012-2021, however, the 2022 vintage PUMA boundaries affect these codes. The area that PUMA 7303 encompassed (Vista City) from 2012-2021 is covered by PUMA 7323 in 2022-onwards (you can see an overlay of the two PUMA vintages on this page).
2024-07-29 · USA
David’s suggestion regarding multiple approaches to calculating weighted medians is helpful and important to keep in mind. For example, spatstat offers three different algorithms for calculating a median in cases when the standard median is not represented in the data. When running this analysis using the different median types however, I was unable to perfectly replicate the findings from the blog that you shared. Running this analysis with the 2022 5-year file, I am finding a median household income of $184,187 (spatstat type = 2) for pre-1950 single-family detached units and $134,465 for pre-1950 single-family attached units for California PUMA 00101 (the PUMA had identical boundaries across the 2012-2021 and 2022-2031 vintages). You may try contacting the author of the post to determine how they arrived at their estimates.
Household income is not provided for group quarters (see the universe statement for HHINCOME), so there is no necessity to filter these observations from your data. You are correct however to note that you should only include a single observation per household in your analysis (often implemented by filtering to PERNUM = 1). You can also do this by requesting a household-only extract from the extract options menu (available after submitting your data cart, but before submitting your extract). An additional detail to note about HHINCOME is that the values refer to dollars in the year the survey was conducted (i.e., the dollar amount reported by respondents in that year), except in multi-year files where the original amounts have been standardized to dollars as valued in the final year of data included in the file (e.g., 2022 dollars for the 2018-2022 5-year file).
2024-07-29 · International · marked as solution
Data for the Mosaic project is provided by its partners, which include an international team of historians, demographers, economists and other researchers from institutions in Europe and beyond. We do not have additional documentation for this data beyond what is available on the project website. I recommend reaching out to our partners regarding documentation of the variables in the GIS files as noted in the citation provided with the 1871-1931 Germany files (at the Max Planck Institute and the University of Rostock).
I was able to review the files and can share my own thoughts of what it appears the variables may be referring to. This is not definitive and I am unable to provide further support on this data, but I hope that this is a helpful starting point.
Area appears to be the area of the unit in square kilometers.
RB appears to refer to the abbreviated Regierungsbezirk (administrative district name).
Status seems to be used for areas that were not part of an RB district. I suspect that these are the codes for the different types of areas:
Shape_Area is most likely the area of the unit in decimal degrees.
2024-07-29 · General
Data for the Mosaic project is provided by its partners, which include an international team of historians, demographers, economists and other researchers from institutions in Europe and beyond. We do not have additional documentation for this data beyond what is available on the project website. I recommend reaching out to our partners regarding documentation of the variables in the GIS files as noted in the citation provided with the 1871-1931 Germany files (at the Max Planck Institute and the University of Rostock).
I was able to review the files and can share my own thoughts of what it appears the variables may be referring to. This is not definitive and I am unable to provide further support on this data, but I hope that this is a helpful starting point.
Area appears to be the area of the unit in square kilometers.
RB appears to refer to the abbreviated Regierungsbezirk (administrative district name).
Status seems to be used for areas that were not part of an RB district. I suspect that these are the codes for the different types of areas:
Shape_Area is most likely the area of the unit in decimal degrees.
2024-07-24 · General
The online Survey Documentation and Analysis (SDA) tool does not have the computing capacity to calculate a median beyond a certain number of observations. In this case, the tool offers users the option to calculate the median using a remedian technique that mimics an ordinary sample median while using less storage (see the SDA documentation). To request the SDA tool to calculate a remedian, check the box next to Estimate the values of medians or percentiles under the Median/Percentile Options (see screenshot below).
You will additionally need to filter out the NIU code for HHINCOME (see the Codes tab). Since the samples in the SDA tool are all person-level microdata, you will also need to include the filter PERNUM(1) so that each household is only counted once and change the weight to the household weight.
2024-07-23 · USA
Yes, we plan to extend both MIGRATE1 and MIGTYPE1 for the 2022 samples in a future release; these variables require special handling to account for the changes in PUMA (and MIGPUMA) boundaries with the 2022 ACS.
A number of other migration variables are currently available in the 2022 5-year file including MIGPLAC1 (State or country of residence 1 year ago), which will allow you to identify some of the categories in MIGRATE1 including movers between states, non-movers, and those who moved from abroad. MIGMET131 together with MIGPUMA will similarly allow you to identify respondents with MIGTYPE1 categories N/A, Not in metropolitan area, and Abroad. Please note when using a 5-year file that bridges two PUMA/MIGPUMA definitions (such as the 2022 5-year file) that geography variables for observations included in the years before the change (i.e., MULTYEAR = 2018-2021) are created using the older vintage boundaries, while observations in the period after the change and created using the newer vintage. This can significantly affect your estimates if, for example, a metro area in MIGMET131 is identified in the earlier period, but not in the latter. This can also affect estimates for MIGTYPE1, which depend on the number and size of cities and metropolitan areas that can be identified using MIGPUMA1.
IPUMS NHGIS also releases summary tables created by the Census Bureau that report geographically aggregated estimates using ACS data (for geographies as small as census tracts in 5-year ACS files). The estimates in these tables do not rely on MIG/PUMA, but come from the internal Census file. The 2022 5-year ACS summary tables include estimates of the number of persons who moved within and across MSAs and principal cities that you might consider using if you do not require individual-level microdata.
2024-07-17 · International
Thank you for the kind words Oskar. I can share some good news with you: the IPUMS International team is currently processing the Kenya 2019 Census data as part of a second 2024 data release. The team plans for this release to occur sometime in the next several months. There will be a user email announcing the release and the revision history page will be updated to reflect the addition of the new samples.
2024-07-17 · CPS · marked as solution
Unfortunately, IPUMS also does not have sufficient documentation to process these early job tenure supplement files. As you mention, there is significant documentation missing for the data files for both of these years. This includes missing pages from the codebook (1978) and apparent mismatches between the codebook and the data files (1981). In 1981 specifically, we are unable to uniquely identify persons. You can find more details about issues with identifying unique household and person records in the CPS in Flood, S., Rodgers, R., Pacas, J., Kristiansen, D., & Klaas, B. (2022). Due to these significant concerns regarding the reliability of the data, we do not currently plan to make them available via IPUMS CPS.
2024-07-17 · USA
Thanks for bringing this issue to our attention. I can confirm that it does appear that Dade county is listed under SEA 69 in the 1940 full count and that SEA 70 is not present in this sample. I’ve shared your post with our historical data team who will be able to take a closer look at this issue in the next few weeks; I’ll follow up with their response and any additional relevant information. In the meantime, you should be able to continue identifying Dade county separately from other counties in SEA 69 using SEA = 69 & COUNTYICP = 250.
2024-07-15 · USA
You may be able to tease out some family caregivers from unrelated people employed as personal care aides or home health care aides with the variables CLASSWKR (class of worker) and TRANWORK (means of transportation to work). CLASSWKR may be useful for this as it allows you to identify persons who work at a company separately from those who are self-employed or those who work without pay for family. The questionnaire text tab for CLASSWKR shows how these different options were presented to respondents. Viewing the layout of the respondent questionnaire might also be helpful in contextualizing this self-reported occupation data and determining in which cases family caregivers are most and least likely to be included in these occupations. In addition, TRANWORK can help isolate family caregivers when they live together with the family member that they take care of (i.e., those who report TRANWORK = 80, “worked at home”) . You can use RELATE (relationship to household head) with TRANWORK to further separate relatives from unrelated live-in caregivers.
The American Time Use Survey may also help you find additional details about time spent on care for household and non-household members, since the data includes the relationship of the respondent to anyone who was present during an activity (see RELATEW). You might use this data to determine the frequency of paid family care as a primary occupation among all personal care aids and home health care aids (see OCC).
2024-07-12 · USA
MET2013 has not been updated in the 2022 1-year ACS file since the data was first released on November 21, 2023. I can provide further guidance if you could share additional details about the samples you are matching, your matching process, and which cases are not matching correctly.
It may be relevant to note that the Census Bureau introduced revised Public Use Microdata Area (PUMA) boundaries in 2022, which affected identification of MET2013 (see the description and comparability tabs for MET2013). Whereas ACS data collected from 2012-2021 used 2010 Census based PUMA boundaries, data collected from 2022-onwards reports household residence using 2020 Census based PUMAs. This results in some metropolitan areas that were identified in 2012-2021 not being identified in 2022, and vice versa. All households in the 2022 1-year file are identified with the new PUMA boundaries. In the 5-year file, respondents surveyed from 2018-2021 are identified with 2010 Census based boundaries, while those surveyed in 2022 (MULTYEAR = 2022) are identified using the new boundaries.
2024-07-12 · CPS
The ASEC supplement is conducted in March while the Civic Engagement supplement is fielded in September (2017-onwards) or November (2008-2013). In the CPS panel design, households enter the panel for four consecutive months, take an eight month break, and are then re-interviewed for an additional four months before leaving the panel. Due to this design, no one who is interviewed in March is interviewed in the period from July-November. The IPUMS CPS RoPES tool, accessed from the IPUMS CPS main page, can be helpful to visualize this pattern.
Here I’ve focused on the 2016 ASEC and selected the tool to display the distribution of respondents included in the 2016 ASEC across the panel. As you can see, respondents to the ASEC never overlap with the Civic Engagement Supplement. The Linking the CPS User Guide includes a video tutorial that further explains the rotational pattern and how to use the RoPES tool.
2024-07-12 · USA
Personal care aids, identified with OCC = 3602 (2018-onwards) and OCC = 4610 (2000-2017), provide personalized assistance to individuals with disabilities or illness who require help with personal care and activities of daily living support. Home health care aides, identified with OCC = 3601 (2018-onwards) and OCC = 3600 (2000-2017), provide routine medical care under the direction of offsite or intermittent onsite licensed nursing staff; they may additionally provide assistance for activities of daily living. ACS OCC codes correspond to codes in the Standard Occupational Classification (SOC) System, which you can refer to for a detailed description and illustrative examples for each occupation code. Personal care aids are identified with SOC code 31-1122 and home health care aides with code 31-1121 in the 2018 SOC system (used in the 2018-onwards ACS samples). Occupation codes in the 2010-2017 ACS samples meanwhile are based on the 2010 SOC system where personal care aides are identified with code 39-9021 and home health aides with code 31-1011. Note that while home health aides have their own SOC code, they are not identified with their own code in the ACS data from 2000-2017, but are grouped together with psychiatric aides, nursing assistants, and orderlies into a single OCC code (3600).
Please be aware that OCC reports the person’s primary occupation. Generally, the primary occupation is the one from which the person earns the most money; if respondents were not sure about this, they were to report the one at which they spent the most time. This means that respondents who worked as family caregivers as a secondary job will not be identified in OCC. There is also no variable that reports the relationship of the respondent to the care recipient that would allow family caregivers to be separately identified.
Regarding industry, your understanding is mostly correct. If hired directly by the care recipient, they would be classified into the private household industry (IND = 9290). Otherwise, they would be classified as working in individual and family services (IND = 8370) if providing non-medical home care through an establishment or home health care services (IND = 8170) if providing medical home care. This refers to industry codes from 2018-onwards that are based on the 2017 North American Industry Classification System (NAICS). For information about industry codes from prior years, please refer to the codes tab for IND.
You might also want to take a look at the American Time Use Survey (IPUMS ATUS), which includes information from respondents on their occupation, who they spent time with on activities throughout the day, as well as separate variables about time spent on care work for household and non-household members.
2024-07-12 · USA · marked as solution
It is inadvisable to attempt linkage from the 1950 1% sample to the 1950 full count file due to the high probability of making a false match. For this reason, IPUMS has not linked this sample with any others. The high probability of mismatch is driven by the lack of data on respondent names as well as limited geographic identifiers in the data shared with IPUMS.
HISTID is a consistent individual-level identifier that was introduced to make it easier for users to trace how revisions to the historical full count data affected individual observations. For this reason, it was never made available for the representative (sub-100% samples). However, even if HISTID values were available for this sample, they would not be able to be linked to respondents in other years due to the data limitations stated above.
In contrast, first (NAMEFRST) and last (NAMELAST) names are included in the 1850-1930 IPUMS representative samples. This is the main driver of the linking algorithm in the linked representative samples (LRS) database, which links records from the 1880 complete-count database to 1% census samples from 1850-1930.
The absence of enumeration district (ENUMDIST) or other granular geographic identifiers in the data additionally make it unwise to link this sample to other samples even from the same year. Instead of enumeration districts, the lowest geographic identifier available for all respondents is the SEA (State Economic Area). These are generally either single large urban counties or groups of contiguous counties within the same state. In the case where the SEA consists of a single county, that county is also identified in COUNTYICP. Regarding the variable CITY, the comparability tab for the variables notes that (in the 1950 1% sample) only central cities of metropolitan areas with a population of at least 200,000 (in 1980) are identified, and metropolitan areas with multiple central cities (e.g., New York City ) are combined into a single code.
I wish that I could have shared better news, but I hope this information helps you make the best decision on how to proceed with your study.
2024-07-12 · CPS
There is an option to add data quality flags to variables in your data cart when you request your extract. This forum post explains how to use this tool. These flag variables report if, and the method by which, the Census Bureau allocated the variable for the respondent during processing, either due to missing data, illogical values, or to top coding. The first two types of allocations are typically reported in the allocation data quality flags (e.g. QINCLONG for INCLONGJ), while the latter is reported in a separate top code flag (e.g. TINCLONGJ). Top coding occurs when a value is high enough to meet a threshold to be censored and assigned the corresponding top code (see this page for detailed top code documentation).
The data quality flag variables can also be found and added manually for each variable by referring to the variable’s flags tab (e.g. flags tab for INCLONGJ). Finally, there is a search tool that you can use to search for and quickly add multiple data quality flag variables to your cart. The easiest way to do so is by entering the term “Data quality flag for” or “Topcode flag for”, followed by the variable that you are interested in. For example, searching for "Data quality flag for INCWAGE’’ will give you a link to QINCWAGE.
Note that data quality flags are not always available and their availability depends on what is released by the Census Bureau in the public use file. For example, QINCWAGE has not been released since 1987.
Accounting identities for summed income variables are typically described in the comparability tabs (e.g. INCTOT, INCRETIR). While IPUMS CPS provides documentation and harmonizes CPS variables, we release the data as it is shared by the Census Bureau and do not validate or correct income subtotals and totals. When we do find systematic complications in the data, we note them in the documentation tabs for specific variables.
2024-07-09 · CPS
FSMLSWHLS, FSCOMCTR, and other CPS FSS variables are determined on the household level. Unweighted frequencies for these variables are therefore reported as household counts (e.g, the number of households that received delivered meals). I suspect that you are analyzing person-level data and obtaining person-level counts that do not match the household figures. You can add the filter PERNUM = 1 to person-level data in order to count only a single observation per household. Below is my tabulation for FSMLSWHLS, which matches the counts on the codes tab. The same can be used to obtain the household counts for FSCOMCTR.

Weighted household frequencies can be obtained for FSMLSWHLS and FSCOMCTR by using the FSS household weight FSSUPPWTH (for some FSS variables/samples, FSHWTSCALE should be used for household-level analysis). Users can also obtain weighted person-level frequencies by applying the FSS person weight FSSUPPWT. To obtain weighted frequencies, we recommend that Stata users set their data with the svyset command: svyset [pw = fssuppwth] or svyset [pw = fssuppwt]. You can then run tabulations with the svy prefix, including the subpop option (if pernum ==1) for household-level analyses. The screenshot below shows this type of analysis, with the total (132,246,781) being an estimate of the total number of households in the US.
The universe statement for HESC1 (the original CPS source variable for FSMLSWHLS) in the December 2021 CPS codebook provides additional context for this variable. It notes that only hosueholds (HRPOOR = 1 OR HESS1 = 2, 3, 4, or -2 OR HES9 = 1 or -2) AND PRTAGE >= 60 for any HH member will have an in-universe response for FSMLSWHLS. HRPOOR is harmonized by IPUMS as FSPOOR (Household poverty status), HESS1 as FSFOODS (Enough and kinds of food eaten in the household), and HES9 as FSSHORT (Ever run short of money for food in past year). PRTAGE is the AGE of a household member. This universe statement is also described in the description and universe tabs for FSMLSWHLS; FSSCREEN additionally identifies FSFOODS and FSSHORT as the two preliminary screening questions about food stress. Therefore, the universe in the codebook translates to: (FSPOOR = 1 OR FSFOODS = 2, 3, 4, or 97 [“Don’t Know”] OR FSSHORT = 2 or 97) AND AGE >= 60 for any HH member. The household age parameter can be generated by summing an indicator for age 60+ across household SERIAL numbers (if using a single month of data) or across YEAR, MONTH, and SERIAL (if including multiple months/years of data).
2024-07-04 · General
Most poverty measures are reported on the individual level (e.g., percent of people in poverty). SPMWT is provided to weight observations for family-level analyses (e.g., percent of families receiving foodstamps) where the data is restricted to one individual per SPM family unit (SPMFAMUNIT). There are no replicate weights provided for family-level analyses and I was unable to find any specific guidance on whether person replicate weights or household replicate weights can be used in this case.
In some contexts (such as described in the American Community Survey Design and Methodology Report) where family weights are not available, the Census Bureau will produce family-level estimates using household weights. It may therefore be possible to use household replicate weights (REPWT) for family-level variance calculations with SPMWT. To do this in Stata, you will first want to create a variable that identifies one member of each SPM unit and then use the subpop option for your analysis: svy, subpop(if "your_SPM_identifier" == 1): command. See the replicate weight user guide for more information and code for running this analysis in other statistics packages. I am not aware of anyone who is running this type of analysis, so for further clarification I recommend reaching out to an expert at the Census Bureau.
2024-07-03 · General
This type of question is outside the scope of the IPUMS user support team. Most surveys that IPUMS harmonizes have a sampling frame that includes the civilian noninstitutionalized population for a given country/year; in the case you outline however, people only enter the sample if they were a patient at one of the health institutions included in your first stage. Households where no one visited a health institution during the survey period will have zero inclusion probability. You might therefore use weights to make interferences that are representative of the national patient population (rather than the total national population). You should consult the current methods being used by others in the field to adjust for this. Someone else on the forum might be able to provide more guidance as well.
If you are interested in using US health data that is nationally representative, IPUMS MEPS provides longitudinal data from 1996 to the present on health status, medical conditions, healthcare utilization, prescribed medicines, and healthcare expenditures.
2024-06-21 · Global Health · marked as solution
IPUMS does not currently provide any guidance or resources on spatial harmonization across IPUMS-DHS and IPUMS-MICS, however I can provide a few resources to get started.
Shapefiles that provide GIS formatted boundaries of identified areas in IPUMS-DHS are available for download as are shapefiles with boundaries of areas identified in IPUMS-MICS. By overlaying the DHS and MICS shapefiles for each country, you can determine which areas are identified across both families of surveys. You may match either consistent boundaries for each country that have been harmonized over time (e.g., GEO_BD1994_2014 in DHS and GEO1_BD in MICS for Bangladesh) or sample specific boundaries if you want to identify administrative areas whose boundaries changed over time (e.g., GEO_BD2007 in DHS and GEO1_BD2006 in MICS allow users to separately identify residents of Sylhet Division from Chittagong in years after their 1995 split).
Sometimes, MICS or DHS will have additional levels of geographic detail that are unavailable in the other survey family. In the case of Bangladesh, IPUMS-MICS provides the district of residence (GEO2_BD) in addition to the division, whereas IPUMS-DHS only provides the division. Typically, however, DHS surveys will have more geographic detail than MICS surveys. This is because DHS users can also access geographic shapefiles that report the georeferenced coordinates of household clusters for available samples. These must be accessed directly through the DHS Program website, but can then be merged onto IPUMS extracts.
While there are no current integrated geography resources between IPUMS-MICS and IPUMS-DHS, providing cross-project geography resources is something we are exploring. IPUMS-International has provided a crosswalk between IPUMS-I and IPUMS-DHS geographies. I will share your interest with my colleagues to see whether this crosswalk may be expanded in the future to include IPUMS-MICS.
2024-06-11 · USA · marked as solution
Since your goal of finding the top ten US cities with the greatest foreign-born populations in 2020 does not require individual-level microdata, IPUMS NHGIS is a great choice for getting this data. The reason that you were unable to find data was because the Census Bureau didn’t produce a standard 2020 1-year ACS summary file in 2020 due to irregularities in sampling during the height of the COVID pandemic (see this IPUMS user guide for more information and links to Census Bureau documentation). However, you can find tables by nativity for 1-year ACS files (e.g. 2019, 2021) as well as for 5-year files (e.g. 2016-2020) by including place as your geographic filter in the Data Finder tool. Note that “place” is the Bureau’s general term for all city-like entities and includes both legally incorporated places (e.g. cities) and unincorporated centers of population that the Census Bureau groups into census designated places (CDP).
Unlike the tables in IPUMS NHGIS, the ACS Public Use Microdata File that IPUMS USA harmonizes does not report the city that a respondent resided in; STATE and PUMA are the only geographic identifiers provided. Where PUMA and city boundaries closely align, IPUMS USA identifies the CITY that PUMA residents resided in. More specifically, the protocol assigns all respondents in a given PUMA to a city if the majority of that PUMA’s population resided within the city limits. This results in errors of omission (residents of a city who are not identified as residents) and errors of commission (non-residents who are identified as residents). If the sum of errors that results from this protocol (CITYERR) is 10% or greater, then the city will not be identified and all respondents in the intersecting PUMAs will have CITY = 0000.
To take an example, the city of Dallas has a commission error of 17.82% and an omission error of 11.27% for a total error of 29.09% in the 2020 ACS (see the “large_placePUMA2010_match_summary” Excel file in the CITY comparability tab). As a result, it is not identified in the data. While you might use the 10 best-matching PUMAs where a majority of respondents resided within Dallas city boundaries to identify Dallas residents, we do not advise this since 29.09% of the residents of these 10 PUMAs did not actually reside within the city of Dallas. You might instead consider analyzing the Dallas-Fort Worth-Arlington metro area, which is identified in MET2013 since the sum of errors for the metro (MET2013ERR) was only equal to 1.85% in 2020. You should be aware that the 2022 ACS introduced new (2020 census based) PUMA boundaries. Anytime new PUMA boundaries are used, it affects the other geographic information that can be inferred from these units, including the cities we can identify using CITY or changes in the omission/commission error for cities that are identifiable after this change.
2024-06-11 · USA
IPUMS NHGIS provides county-level census summary statistics from 1790-onwards that can be used to determine the number of non-White persons living in Montgomery County, Ohio in each decennial census from 1810-1850. No sub-county census data is available prior to 1910 on IPUMS NHGIS. We recommend that new users review the detailed FAQ page as well as the short video tutorials that are part of the user guide in order to familiarize themselves with the website and the Data Finder tool. You will need to add a data table to your data cart for each decennial year separately (i.e., 1810, 1820, 1830, 1840, and 1850) that summarizes race by county.
It’s important to keep in mind that each census differed in the way it enumerated persons of different races. In particular, Black Americans were tabulated separately depending on whether they were free or if they were slaves. Below is the wording used for tabulating each of these different racial categories for each decennial census. IPUMS NHGIS identifies race by grouping White persons into a White category and all other persons into a Nonwhite category.
1810 census: free White persons, slaves, and “all other free persons, except Indians, not taxed”
1820 census: free White persons, slaves, “free Colored persons”, and all other persons, except Indians not taxed
1830 census: free White persons, slaves, and free Colored persons
1840 census: free White persons, slaves, and free Colored persons
1850 census: White, Colored (free), Colored (slave)
I was also able to find the compendiums for the 1820 and the 1840 censuses which included summary counts by race and slave status for the town of Dayton, Ohio. You can also find household-level data in the IPUMS USA 1790-1840 household full count file.
2024-06-07 · Time Use
While I don’t have experience with python, you might find this forum post on calculating weighted estimates with python code helpful. You should be able to adapt it by substituting WT06 for ASECWT and RWT06 for REPWTP (you can read more about replicate weights in the RWT06 variable description tab as well as on IPUMS CPS).
This solution is different than using svy in Stata or svyr in R, as this is a one-time calculation for a single estimate that functions differently from those other libraries. Many commands in pandas have a weights key word argument and the statsmodels library has the ability to apply frequency weights for as well - the DescrStatsW class may be of help for descriptive statistics and simple hypothesis testing: statsmodels.stats.weightstats.DescrStatsW - statsmodels 0.15.0 (+306)
2024-06-07 · CPS
Hi Yun Taek,
The CPS ASEC supplement contains respondents who completed the CPS March Basic Survey as well as oversample respondents drawn from samples from previous months. CPSIDP = 0 refers to these CPS ASEC oversample respondents (ASECOVERP). IPUMS CPS does not currently link respondents of the oversample to their Basic Monthly CPS interview. As a result, these repondents do not have CPSIDP (person level linking key), CPSID (household level linking key), or CPSIDV (validated person-level linking key) values. MARBASECIDP is a unique identifier for linking respondents in the March Basic to their response to the ASEC supplement. However, since ASEC oversample respondents did not complete the March Basic survey, there is no response to link to. Please see our technical write-up for more information on this issue as well as Pacas & Rodgers, 2023 for more information on linking ASEC oversample respondents.
IPUMS CPS users can request longitudinal ASEC samples directly from the Select Samples page (select Longitudinal, 1 year apart). These samples automatically exclude individuals who belong to the ASEC oversample. More information about these linked samples can be found in the longitudinal sample notes.
2024-06-07 · General
It sounds like your data file is too large for your system to process. I recommend selecting fewer samples, using the customize sample option to request a random subsample of your data, or using the select cases tool to request a subsample of your data that limit your file to records meeting specified criteria based on variables included in your extract.
2024-06-07 · CPS · marked as solution
While I don’t have experience with python, I was able to run this same analysis in Stata on the 2023 ASEC sample with the svy sdr command in the sample Stata code that we provide and got the same result that you report. Specifically, the lower bound of my 95% confidence interval was 612.3 and the upper bound was 4339. This seems to confirm that your code correctly implements the replicate weights for estimating confidence intervals.
The unused REPWTP is for the Census Bureau to internally verify that the files are properly merged to the public use survey data. In IPUMS CPS, it merely indicates the presence of replicate weights and is coded 1 for every case.
I believe the 4/160 is the multiplier that is analogous to setting Fay’s coefficient = 0.5 (the 4 in the numerator is 1/(1-rho)^2). For more information, I recommend reviewing the references cited in the word document that you link to (particularly Judkins, 1990).
2024-06-06 · USA
The ACS Public Use Microdata Sample reports respondents’ place of residence 1 year ago in terms of their Migration Public Use Microdata Area (MIGPUMA1) and State/Country (MIGPLAC1). In cases where Migration PUMA boundaries closely align with those of a metropolitan area, we identify the metro in MIGMET131. You can read more about the protocol used in this assignment on the MIGMET131 variable page (see previous link). MIGMET131 is one of many variables that are not available for analysis in the online tool; you will need to request a customized extract with this variable to run a MSA-to-MSA migration analysis.
You might alternatively run a State-to-MSA or MIGPUMA-to-MSA migration analysis using the online tool since MIGPUMA1 and MIGPLAC1 are both available through the system. To do so, you will want to cross-tabulate one of these variables with MET2013 (current metro area of residence). MET2013 uses a similar protocol to MIGMET131 in assigning households to metro areas. Below is an example of a State-to-MSA migration analysis for the period 2018-2022 using the online tool. This will report the percent of the population in each of Arizona’s metro areas who did not move in the past year (MIGPLAC1 = 0) and the percent that moved from each state. The filter STATEFIP = 4 restricts the analysis to respondents who resided in Arizona at the time of the survey. MIGPLAC1 = 4 identifies respondents who had moved residences in the past year, but remained in Arizona. They may have moved across the state or stayed within the same metro area. An MSA-to-MSA level analysis would be required to determine this.
The assignment protocol for MIGMET131 is imperfect in cases where MIGPUMA boundaries do not perfectly coincide with metro area borders. This is also true for MET2013, which uses PUMA boundaries to assign households to their current metro of residence. The protocol assigns all households in a PUMA (MIGPUMA) to a metro area if the majority of the households in that PUMA (MIGPUMA) are located within that metro. This results in errors of omission (residents of a MSA who are not identified as residents) and errors of commission (non-residents who are identified as residents). These errors are identified in the MET2013 delineation files (MIGMET131 variable page) and are reported in MET2013ERR (MIGMET13ERR). IPUMS USA will not identify the current metro area (metro area of previous residence) where this protocol yields a sum of match errors of 15% or more. An added complication is that a new PUMA and Migration PUMA map is issued roughly every 10 years (in 2005, 2012, and 2022), which can cause a significant change in a metro area’s omission/commission errors. As a result of the revision in MIGPUMAs in 2022, respondents who moved from the Tucson metro area are not identified starting in 2022.
Some users may be concerned with the amount of potential measurement error that is created when compounding errors in MET2013 identification with errors in MIGMET131. This is often a compromise that users of microdata have to make in exchange for the flexibility of multivariate analysis. If you determine that the cost of this measurement error in the microdata is greater than the benefit of using microdata, then you might consider using the aggregate metro-to-metro migration flow tables released by the Census Bureau.
2024-06-04 · General
MIGRATE1 has not yet been integrated into the 2022 5-year ACS file (the availability tab indicates that it is available in the 2022 1-year ACS, but not all 2022 samples). MIGRATE1 is determined based on Migration Public Use Microdata Areas, or Migration PUMAs (see MIGPUMA1). The boundaries of these Migration PUMAs changed in 2022. As a result, the 2022 5-year ACS includes respondents interviewed using the older vintage (MULTYEAR = 2018-2021) as well those using the newer (MULTYEAR = 2022). IPUMS does not yet provide MIGRATE1 for the 2022 5-year ACS as we are currently in the process of modifying the variable to take into account both versions of Migration PUMAs that span the sample. We plan to offer MIGRATE1 in the 2022 5-year file in the future, but I would not expect it to be available sooner than in the next 4-6 months.
A number of other migration variables are currently available in the 2022 5-year file including MIGPLAC1 (State or country of residence 1 year ago), which will allow you to identify movers between states, non-movers, and those who moved from abroad. Additionally, you might consider using the individual 1-year ACS files (MIGRATE1 is available in all 1-year ACS files) instead of the 5-year file. While the 5-year file allows users to generate estimates to describe the 5-year period as a whole (e.g. the percent of Texas’s population that moved from California from 2018-2022), the 1-year files are the best way to produce estimates for individual years (e.g. how did this value change each year) and can also be aggregated to produce averages over multiple years.
2024-05-31 · Time Use · marked as solution
The Blank code (99999.98) is used for SPEARNWEEK in cases where there is no data on the spouse’s earnings. The ATUS interview does not ask about the respondent’s spouse’s earnings, but only their employment status and usual working hours. The data for this variable instead comes from responses to the final Current Population Survey (CPS) interview. ATUS respondents are a subset of CPS respondents and are interviewed 2-5 months following their final CPS interview (read more about the CPS rotation pattern here). In order to decrease response burden, some questions that were already asked as part of the CPS are not asked in the ATUS interview. For example, ATUS respondents are only asked about their weekly earnings when there is evidence that the respondent’s job changed, when the respondent went from not employed to employed, or if the CPS weekly earnings value was imputed. Otherwise, the value that was recorded in the CPS interview (in EARNWEEK) is used.
ATUS respondents are never asked about their spouse’s weekly earnings, which are instead always inferred from the spouse’s value for EARNWEEK. As a result, any time EARNWEEK is unavailable for a respondent’s spouse, SPEARNWEEK will be allocated to Blank (99999.98). The Universe tab for EARNWEEK notes that only employed civilians who are not self-employed are in-universe for this variable. The vast majority of cases of SPEARNWEEK = 99999.98 therefore refer to spouses who were either not employed or self-employed at the time of the final CPS interview. Additional cases include those where the ATUS respondent did not have a spouse in the household at the time of the final CPS interview, but does by the time of the ATUS interview (respondents with no spouses in the household at the time of the ATUS interview will have SPEARNWEEK = 99999.99).
As I mentioned previously, the spouse’s employment status and usual working hours are typically asked as part of the ATUS interview. This results in a temporal mismatch between SPEMPNOT and SPEARNWEEK. The cases that you are finding are spouses who either became employed between the two interviews or continued to be self-employed (thus not having any earnings data, but still employed according to SPEMPNOT).
You might be interested in linking ATUS respondents to their final CPS interview in order to investigate this pattern further. To do so, you will need to create an IPUMS ATUS extract that includes CPSIDP, a variable that uniquely identifies individuals across ATUS and CPS samples. You will then want to create a data extract on IPUMS CPS that includes respondents from your ATUS sample, adding variables of interest such as EARNWEEK and using the attach characteristics tool to add the spouse’s values for these as an additional variable (see this FAQ question as well as this video tutorial for reference). The ATUS interview takes place 2-5 months following the final CPS interview and a subsample of CPS respondents are interviewed for the ATUS throughout the year (i.e., 2022 ATUS respondents should have had their final CPS interview month within the period from August 2021-October 2022). You can find the month and year of the final CPS interview for ATUS respondents in the variables MONTH_CPS8 and YEAR_CPS8. Once you have both IPUMS ATUS and IPUMS CPS extracts, you can merge records between the two using CPSIDP and observe the respondent’s spouse’s data. Note that since weekly earnings are only asked in the fourth and eighth monthly interviews of the CPS (reported in the IPUMS CPS variable MISH), you will want to merge data from one of these periods.
2024-05-31 · General
I am not a SAS user, so the amount of code support that I can provide is very limited. However, based on my review of the syntax in the IPUMS training exercises for SAS (see exercise one and exercise two) and your stated goal, I can share a few recommendations.
The variable OWNERSHP identifies whether a given housing unit is occupied by someone who owns/has a mortgage on this property or is being rented by its occupants. Since it is only available in a single sample each year (the Annual Social and Economic Supplement, or ASEC, fielded in March), you will not be able to use it to obtain monthly estimates of the total number of households. Instead, you should request an extract with basic monthly samples (non-ASEC) and include a person-level variable available in each month such as SEX.
HWTFINL is the correct weight to use for household-level aggregate estimates.
You should include the line where pernum in (1); in your proc freq statement. PERNUM sequentially numbers person records within the household. In order to produce household-level estimates for data where each row is an individual person, you will want to restrict your analysis to one person per household. The easiest way to do this is to include observations with PERNUM = 1.
Note that a household refers to all the people (related and unrelated) who occupy a housing unit (such as a house or apartment) and that a count of the number of households is really a count of the number of occupied housing units (although the CPS excludes institutional group quarters such as correctional institutions). You can find a quarterly count of the total number of occupied housing units in the US from FRED.
2024-05-30 · USA
I believe that you’re referring to the 1950 and 1960 census data; the ACS was first conducted in 2001. The issue that you’re encountering is that CITY identifies the city of residence for households located in identifiable cities. While one might expect New York City to be an identifiable city, especially given that there are observations that are assigned to that city, the comparability tab for the variable provides more information on sample-by-sample identifiability. Regarding the 1950 1% sample, it states that only the central cities of metropolitan areas are identified. Moreover, if a metropolitan area had more than one central city, then all central cities of this metro will share the same city code (i.e., the code of the largest city). The accompanying list identifies the following groups of central cities and includes “New York, NY, Newark, Jersey City, and Paterson, NJ”. This means that the 8,735,653 figure that you are observing for 1950 is actually referring to the combined populations of all four of these cities. Luckily, the solution in this case is simple: you can filter your observations to only include respondents in New York State (STATEFIP = 36). Doing so, I find a population of 7,991,312 for the NY State portion of CITY = 4610 (only 1.26% greater than the Census estimate you quote). There does not appear to be such as issue with the IPUMS 1960 5% sample.
You might additionally be interested in using the recently released 1950 full count file that contains all enumerated persons from the 1950 census. In this sample, the city of residence is given for households in any city with 10,000+ inhabitants. While this is a preliminary release with several noted issues, the estimate I get for the population of NYC using this sample is even more accurate at 7,932,929 (0.5% greater than the Census estimate).
2024-05-29 · USA
The answer depends on the sample you are analyzing. There is a lot of detail documented on weights in IPUMS USA. A good place to begin reviewing this information is the description and comparability tabs for PERWT as well as the sample weights section of the Intro to IPUMS USA Guide. The person-level weights generally represent the inverse probability of selection into the sample. In flat decennial census samples, including the full count files, the weights are identical for each person since each U.S. resident had the same probability of being included in the data. In a full count file, each individual gets assigned a PERWT of one whereas in a flat subsample, such as the 2010 10% file, each individual gets a PERWT of ten. This is done so that the sum of PERWT equals the total US resident population in that year. More information about the construction of PERWT in weighted historical samples can be found in the IPUMS User Guide on Sample Designs.
In the American Community Survey (ACS), the process of weight creation is documented in Chapter 11 of the Design and Methodology Report. This processing is done by the Census Bureau and the weights are released as variables that IPUMS integrates into our extract system. The report notes that weights are used to bring the characteristics of the sample more into agreement with those of the full population by compensating for differences in sampling rates across areas, differences between the full sample and the interviewed sample, and differences between the sample and independent estimates of basic demographic characteristics. In short, the ACS uses county-level estimates of the number of housing units and persons by age, sex, race, and Hispanic origin produced by the Population Estimates Program (PEP) to construct weights such that the weighted estimates for each group conform to the PEP values (see Population Controls in the ACS User Handbook). Additional steps including the monthly sample factor and non-interview adjustment are documented in the linked report.
2024-05-24 · USA
Yes, code 22 (Wage/Salary, Private) in the variable CLASSWKRD identifies employees of private for-profit companies or businesses for wages, salary, or commissions. Employees of private not-for-profit, tax-exempt, or charitable organizations are coded as Wage/salary at non-profit (CLASSWKRD = 23). In addition to reviewing the Questionnaire Text tab, you can also find how IPUMS harmonized the original data by reviewing frequencies from the source variables (e.g. US2022A_COW).
Most variables in IPUMS have a composite coding structure, where the first digit is largely comparable across samples, and second and subsequent digits provide progressively more detail available in some samples and not others. This rule is used in the coding scheme of CLASSWKR where wages and salary workers are identified with codes that start with a “2” to distinguish them from self-employed respondents (except for CLASSWKRD = 29). Codes 22-23 identify employees of private firms and codes 24-28 identify government employees. CLASSWKRD = 23 provides further detail by identifying a type of wage/salary, private employee (i.e., one that works at a non-profit). This is indicated by the label being indented in the Codes tab.
2024-05-22 · Health Surveys
You can use the variable RACENEW in combination with HISPYN to identify the race of Hispanic respondents. Note that the 2019 NHIS discontinued the practice of imputing the race of respondents in cases where this information was not available, and as a result, the 2019-forward NHIS samples include Unknown-Refused, Unknown-Not Ascertained, and Unknown-Don’t Know as possible responses for RACENEW. The NHIS however continues to allocate the Hispanic origin of respondents for such cases with a hot-deck imputation method that uses information on other household members as well as state and national modal values.
2024-05-21 · General
LITBRIG is a categorical variable where values correspond to distinct responses rather than a specific literacy level (see the Codes tab for LITBRIG). Calculating the mean of LITBRIG will therefore not produce a meaningful literacy rate measure. For example, a value of LITBRIG = 20 identifies respondents who cannot read. Additionally, LITBRIG = 99 identifies respondents who are NIU (i.e., not-in-universe) for the variable. These are persons who were not asked questions that are required to determine LITBRIG. I suspect that these NIU respondents are causing your literacy rate measure to spike since there are a large number of NIU cases in the three samples you mention. While there are a number of reasons that a respondent might not be asked a particular question, information on who was asked the question(s) that correspond to a variable is summarized in the variable’s universe statement (see the Universe tab for LITBRIG). We recommend that new users review the detailed FAQ page on IPUMS-DHS; question 8 specifically deals with NIU data. Based on my review of this information and original DHS questionnaires, it appears that in India in 1998 and in Bangladesh in 2004, women who had completed grade 6 were not asked about their literacy. Additionally, in Zimbabwe in 1999 women who had ever attended secondary school were also not asked about their literacy.
In order to calculate the literacy rate using LITBRIG, you will need to code respondents to a new dichotomous variable that reports whether the respondent was literate or not. This will require dividing your sample into three groups: respondents who are literate (LITBRIG = 10, 11 and/or 12 depending on the threshold for literacy that you impose) should be assigned a value of one, respondents who are illiterate (LITBRIG = 20 and/or 12) should be assigned a value of 0, and respondents whose level was not ascertained, missing data, and not-in-universe NIU observations (LITBRIG = 31, 32, 98, and 99) should be assigned as missing and excluded from the measure. While it is unclear whether a respondent who was NIU for LITBRIG was literate or not (which is why NIU data is typically set to missing), you might consider coding NIU responses as literate if you have reason to believe that to be the case.
Using the recoding I have suggested above and PERWEIGHT to produce estimates that are representative of the country and survey universe, I estimate literacy rates for Bangladesh, India, and Zimbabwe, as well as Rwanda (see screenshot below). You can find sample R code in the IPUMS data training exercises to help you run a similar analysis.
You should also note that LITBRIG is generally only available for ever married women aged 15-49. This means that your measure would only be measuring the literacy rate for this group. For analyses of literacy rates for the entire population of a particular country, you can use the variable LIT on IPUMS International.

2024-05-16 · General
STATEFIP/STATEICP and COUNTYICP report the state and county that an individual was enumerated in. This is typically the individual’s usual place of residence, but the specific determination differs census-by-census. The instructions to assistant marshals (i.e. enumerators) in 1850 state the following:
Under heading 3, entitled, “The name of every person whose usual place of abode on the 1st day of June, 1850, was in this family,” insert the name of every free person in each family, of every age, including the names of those temporarily absent, as well as those that were at home on that day.
By place of abode is meant the house or usual lodging place of a person. Anyone who is temporarily absent on a journey, or for other purposes, without taking up his place of residence elsewhere, and with the intention of returning again, is to be considered a member of the family which the assistant marshal is enumerating.
Based on these instructions, workers who took jobs in a different county will be enumerated as a part of their family household unless they have taken up residence in the other county and have no intention of returning. Exceptions however are provided for students, sailors, residents of institutions, and for those who usually slept at a store, shop, eating house, and other similar place:
- Students in colleges, academies, or schools, when absent from the families to which they belong, are to be enumerated only as members of the family in which they usually boarded and lodged on the 1st day of June.
- The sailors and hands of a revenue cutter which belongs to a particular port should be enumerated as of that port. A similar rule will apply to those employed in the navigation of the lakes, rivers, and canals. All are to be taken at their homes or usual place of abode, whether present or absent; and if any live on board of vessels or boats who are not so enumerated, they are to be taken as of the place where the vessel or boat is owned, licensed, or registered.
- Assistant marshals are directed to make inquiry at all stores, shops, eating houses, and other similar places, and take the name and description of every person who usually slept there, provided such person is not otherwise enumerated.
- All landlords, jailors, superintendents of poorhouses, garrisons, hospitals, asylums, and other similar institutions, are to be considered as heads of their respective families, and the inmates under their care to be registered as members thereof, and the details concerning each designated in their proper columns.
The instructions in 1860 are very similar and can be found in the questionnaires page. The variable GQTYPE (group quarters) identifies individuals who were enumerated in non-family household quarters. In 1850 & 1860, you can identify individuals who were enumerated at work sites, correctional institutions, and schools, among other group quarters, using GQTYPE. Other variables such as OCC (occupation) may let you better identify employees at institutional group quarters from other members.
2024-05-13 · General
These fixed values refer to official population estimates generated by the Census Bureau from the Population Estimates Program (PEP); these are also the controlled estimates referred to in this Census training presentation. The PEP produces official population estimates using administrative sources such as IRS, Social Security, and Medicare/Medicaid records. Since the ACS samples only about 1% of the US resident population in each year, counts from the survey need to be extrapolated to produce tabulations that are representative of the entire population. The PEP values are used to create weights in the ACS so that the weighted estimates of housing units and persons by age, sex, race, and Hispanic origin conform to estimates from the PEP of the Census Bureau at a specific point in time (see Population Controls in the ACS User Handbook). Since these are official estimates, there is no associated margin of error.
This pattern should only occur for statistics that correspond directly to PEP values. If you do find exceptions, you could consider posing the question on the ACS Data Users Group forum or sending it directly to the Census Bureau.
2024-05-10 · Health Surveys · marked as solution
The “sample adult” component of the universe statement is not entirely intuitive; it does not refer to all sampled adults, but to a singular adult per family/household who was selected to be the sample adult. This blog post is incredibly helpful (specifically figure 1) for describing the Sample Adult concept.
For 1997-2018, a sample adult is the one adult per family (with the possibility of multiple families residing in the same household) who was selected at random by the computerized survey instrument to answer additional health-related questions. In IPUMS NHIS, for variables based on questions asked of sample adults and/or sample children, the universe statement in the variable description refers to “sample adults” and/or “sample children” rather than “persons”. That means that members of the household who were not selected to be asked these additional questions will have NIU values for sample variables. Another redesign of the survey in 2019 reduced the survey to a single sample adult and child within a household, with only basic demographics collected on all remaining household residents.
Sample adults can be identified with the variable ASTATFLG. These NIU cases will be filtered out when subsetting your sample to respondents with ASTATFLG = 1. For further information, I recommend reviewing the IPUMS NHIS user note on sample design as well as the note on the 2019 survey redesign.
2024-05-08 · Global Health
Thank you for bringing this issue to our attention. The Bs in HHID and IDHSHID are used internally to account for blanks in the data, but they should not be appearing in data extracts. The IPUMS DHS team has been alerted of this issue and will release a fix with the next data update. For helping us fix this error, we would like to offer you an IPUMS mug as a token of our gratitude. Please reach out to us at ipums@umn.edu with an address that we can ship your mug to.
In the meantime, you can go ahead and remove these Bs in order to link the records. Alternatively, you can follow the DHS Program linking guidelines and use HV001 + HV002 (CLUSTERNOALL + HHNUMALL) from the household file and V001 + V002 (CLUSTERNO + HHNUM) from the women’s file for linking these records.
2024-05-07 · USA
Hi Uyseok,
Please email us as ipums@umn.edu and I will be able to share this file with you.
For more information, first names were standardized to aid in the linking algorithm for the June 2010 release of the linked representative samples. However, we do not standardize names in the full count data or in the Multigenerational Longitudinal Panel (MLP) links and instead release the original string data for approved restricted users. We do not offer any particular guidelines for analyzing name data. However, you might find the MLP linking study article as well as other relevant articles cited in the IPUMS Full Count Bibliography helpful to review in order to see how others have utilized the data on names. You may also try leveraging the MLP links to obtain information on how individuals’ names were recorded differently over time to aid in your data cleaning process.
2024-05-07 · USA
The additional accuracy for smaller areas that the 5-year microdata sample provides is a result of aggregating observations from the five individual years of data collection since more observations, all else equal, will decrease standard errors. Using the 5-year file to get annual estimates (using MULTYEAR) eliminates this benefit. The 5-year files should be used to produce estimates that describe the five year period that they cover as a whole. Regarding the identification of CITY using PUMA, you should be aware that different cities are identified across vintages of PUMA (2000-2005; 2006-2011; 2012-2021; 2022-2031). The 5-year files that bridge these vintages (e.g. 2022 5-year) identify cities in each vintage separately. For example, a city that is identified in 2018-2021, but not in 2022, will have no observations in the 2022 portion of the 5-year file. Moreover, even when a city is identified across vintages, a change in the PUMA boundaries that affects the omission/commission error may also affect your results.
If your variables of interest are city-level aggregates rather than person-level microdata, then you might consider using IPUMS NHGIS to obtain your data. IPUMS NHGIS releases ACS data tables that summarize variables on small geographic levels such as metro areas and cities (without the use of PUMA as an intermediary step). The 1-year ACS summary data file provides tables for areas with at least 65,000 residents at several geographic levels, including the metropolitan/micropolitan area and place levels. The place level includes both legally defined cities and unincorporated places. For more information on getting started with IPUMS NHGIS, you can refer to the NHGIS FAQ page as well as the video tutorials in the user guide.
2024-04-29 · USA
You are correct that the coding for RACWHT and its 2022 source variable US2022A_RACWHT differ. Respondents who are White alone or in combination are assigned a value of 1 in the source variable (and 0 otherwise). RACWHT harmonizes the source variable by assigning respondents who are White alone or in combination a value of 2 with the label of “Yes” (and otherwise a value of 1 with a label of “No”). You can see this in the Codes tab for each variable.
This is common across many other harmonized binary variables from IPUMS USA. Harmonized variables are available for users who want data that is comparable across ACS and decennial census samples, while source variables are available for those who want to view the original data and apply their own coding structure. If you’d like to reallocate RACWHT so that it follows this source variable coding pattern, you can replace RACWHT values of 1 (“No”) with 0 and values of 2 ("Yes) with 1.
2024-04-29 · Time Use
IPUMS Time Use does not provide linked data or the identifiers used for these links such as respondent names. I recommend referring to the work of Dr. Teresa Harms at the Centre for Time Use Research who linked these respondents to census records and reaching out to her with any questions. This IPUMS blog post includes a video of a presentation by Dr. Harms describing this work.
2024-04-29 · CPS
Filtering to include only one observation per household is the correct way to conduct household-level analyses of the food security supplement variables; using RELATE = 101 is one way to do so, though we typically recommend filtering to observations with PERNUM = 1 instead. This will allow you to use FSHWTSCALE and FSSUPPWTH to produce estimates regarding households that are representative of the U.S. population (e.g., the percent of households that are food insecure). Researchers may also want to conduct individual-level analyses to estimate, for example, the percent of children under 18 who live in food insecure households. In this case, users should retain all cases of RELATE/PERNUM and use the FSS person weight FSSUPPWT.
You are correct that FSSUPINT can’t be used with the select cases tool. As a result, you will need to filter these observations using a stats package once you’ve downloaded the entire extract. Because of occasional cases that don’t adhere to expected universes in the CPS data (in particular for supplement eligibility or completion flags), we have not historically offered variables like FSSUPINT for case selection. I have, however, shared this idea with the IPUMS CPS team to consider.
2024-04-25 · General
I wanted to follow up and share some more information that I learned.
First, there is an easier way to obtain unweighted ConsPUMA densities. The population density of 0010 ConsPUMAs is available as a variable (POPDENSGEO2) on IPUMS International since the second level geographic identifier for the ACS samples on IPUMS-I (GEOLEV2) are ConsPUMAs. These are the unweighted population density values for the entire ConsPUMA. To obtain this data, you will need to create an extract that includes one of the United States samples, GEOLEV2, and POPDENSGEO2. You can then use a stats package to collapse your data to a single observation of each ConsPUMA. Please note that applications to access IPUMS International data are reviewed by our staff and approval to access data typically takes about one week.
Second, the process I outline in the previous response for obtaining a crosswalk between tracts and 2010 PUMAs using IPUMS NHGIS doesn’t work the way that I thought it did. Instead, you can obtain a crosswalk from census tracts to 2010 PUMAs from this Census Bureau webpage. You can then obtain the census tract densities from IPUMS NHGS. Tract-level population data is available for both 5-year ACS ranges and for decennial census years (e.g. 2010 and 2020).
2024-04-25 · General
There is no variable that provides the population density of 0010 ConsPUMAs; you will have to calculate this yourself. The process will depend on whether you want to calculate the density of the whole PUMA or the population-weighted average density as reported in DENSITY.
For the first case, you will need to obtain the total population and land area for each ConsPUMA. The 2010 population of each ConsPUMA is provided on the 0010 ConsPUMA definition page in the CPUMA0010 Summary document. The area of each ConsPUMA can be calculated using either the provided boundary file or by summing the land area (the Part_Land column) across each unique value of CPUMA10 in the 2000-2010 PUMA Crosswalk file on the linked definition page.
For a population-weighted average, you will need to obtain a crosswalk of Census tracts to 0010 ConsPUMAs and apply the method described on the DENSITY variable description page. You can obtain a crosswalk between tracts and 2010 PUMAs (with tract-level population and land area) by using the Data Finder tool on IPUMS NHGIS. You will want to add a table that reports total population and select both tract and PUMA level (note that tract level data is only available for 5-year ranges). You can then use the summary document to aggregate 2010 PUMAs to 0010ConsPUMAs.
2024-04-25 · General
The Census Bureau adjusts the NAICS coding scheme in order to preserve respondent confidentiality while providing the detail necessary for researchers. These letters denote any edits that were applied to the NAICS code by the Bureau. The legend on the INDNAICS crosswalk page provides further information on these suffixes:
M = Multiple NAICS codes
This refers to the aggregation of multiple NAICS codes into a single code for reporting purposes. For example, 32199M aggregates NAICS codes 321991 Manufactured Home (Mobile Home) Manufacturing and 321992 Prefabricated Wood Building Manufacturing.
P = Part of a NAICS code - NAICS code split between two or more Census codes
For example, 2211P (Electric power generation, transmission and distribution) includes some (but not all) industries in 22112 (Electric Power Transmission, Control, and Distribution).
S = Not specified Industry in NAICS sector - Specific to Census codes only
For example, 3MS (Not specified industries) is a code specifically created by the Census Bureau that combines multiple NAICS codes within manufacturing.
Z = Exception to NAICS code - Part of NAICS Industry has own Census code
For example, 3219ZM (Miscellaneous wood products) is a code specifically created by the Census Bureau that is a subset of NAICS code 321999 (All Other Miscellaneous Wood Product Manufacturing).
2024-04-23 · Health Surveys
Both estimated dollar value (FAMTOTINC) and bracketed family income (INCFAM07ON) are not available in the NHIS public use file starting in 2021 (see the Family Income sections from the 2020 public use sample adult codebook and the corresponding 2021 codebook). This data can only be accessed by application through the National Center for Health Statistics Research Data Center (RDC).
A possible solution to this dilemma is to use the IPUMS NHIS variable POVLEV as an alternative path to get at total family income in the 2021 & 2022 NHIS samples. POVLEV reports the ratio of family income to an approximation of the federal poverty line (the specific thresholds are provided on page 113 in the NHIS Survey Description). If you can determine the poverty threshold for the respondent and multiply it by POVLEV, you will obtain an estimate of the total family income. Note that the thresholds vary based on family size. Inferring family size is harder in the 2019-forward NHIS structure, which only interviews one “sample adult” and one “sample child” per household. To determine family size, you could leverage the variables NUMADULTS (number of adults in the respondent’s family, top-coded to a max of three) and FAMKIDNO (number of children in the family). If you decide to proceed with this approach, you will want to pay attention to whether or not the sample adult and sample child are from the same family using SASCRESP (i.e., in the case of multi-family households). You might also be interested in the variable POVERTY, which reports the bracketed poverty ratio and is currently available for IPUMS NHIS samples from 1997-2022.
Note that POVLEV has not yet been integrated by IPUMS for the 2022 NHIS. I am seeing whether we plan to offer this variable in the future. In the meantime, you can download the public use 2022 NHIS sample adult and child files on the NCHS website to obtain POVLEV (POVRATTC_A/POVRATTC_C in the public use files) and merge it with your IPUMS NHIS extract (see this user guide for detailed instructions). This will be a one-to-one merge. Please feel free to follow up if any part of my response is unclear.
2024-04-23 · USA
In order to protect respondent confidentiality, the ACS Public Use Microdata Sample (PUMS) that IPUMS USA provides access to reports household location on the Public Use Microdata (PUMA) level. PUMAs are geographic units created by the Census Bureau that include at least 100,000 inhabitants.
For data on more granular geographies (such as census tracts, counties, and legislative districts), IPUMS NHGIS provides access to tables with summary statistics aggregated to these geographies by the Census Bureau. We recommend that new users review the detailed FAQ and the accompanying User Guide (especially the short video tutorials) to familiarize themselves with the website and how to most effectively use the Data Finder tool.
One option is to obtain this data from the 2020 Census Redistricting Summary File using the Finder tool by filtering to 2020 as your year, including Total Housing Units as your topics filter, and State Legislative District (Lower Chamber) (by State) as your geographic filter. Table H1 Occupancy Status will provide you with the total number of occupied and vacant housing units by legislative district. Another option is to select the 2018-2022 5-year range for your years filter (instead of 2020) and select tables which report data from the 2018-2022 5-year ACS file.
2024-04-22 · USA · marked as solution
Hi Jacob,
NSERIAL is used to identify households residing in the same neighborhood in the 1970 neighborhood samples. Identical NSERIAL values across these two samples refer to the same neighborhoods, though each sample consists of different respondent households. This variable is grouped together with other 1970 neighborhood variables in the extract system. Hope that answers your question!
2024-04-20 · USA
For those visiting this topic in the future, please note that the conversation is continued in this related forum post.
2024-04-19 · USA
Hi Jacob,
I’m glad that my earlier response was helpful. While providing analytical advice is beyond the scope of the IPUMS User Support Team, I can share that there is no technical limitation to pooling together a subset of these three samples. This can be done with just the flat sample without any reweighting, unless you are looking to generate estimates that are aggregate counts. In this case, you would follow the procedure above and divide the weights by the number of pooled samples (i.e. three in the case that you outline). As you note, your estimates from such an analysis would only be valid for the observations that you retain in your sample. I will leave it to you to determine if this is appropriate or how this impacts your interpretation of your results.
2024-04-19 · Time Use
STRATA and CLUSTER are being retained since this data is already available and because some researchers may want to replicate their own findings or the findings of another paper that used these variables in the past. The Census Bureau states that replicate weights are “necessary for generating standard errors for ATUS estimates.” Since replicate weights cannot be combined with STRATA and CLUSTER, using these parameters for variance calculation would be ignoring this requirement. Whether this allows researchers to make external validity claims is up to the researcher to determine based on the literature and their understanding of the econometric theory as presented in the ATUS User Guide (section 7.5).
2024-04-19 · NHGIS
Aloha Kevin,
While IPUMS NHGIS has converted the boundary data from 1992 and 2000 TIGER/Line files into modern shapefiles, this did not include any additional features such as roads. We hope to add road data to NHGIS some day, but there is no current timeline for such a project. You’re likely aware that the 2010 TIGER/Line shapefile with road data is available on the Census Bureau website, though this file only includes 2010 vintage road data. The 2000 and 1992 files are available zipped from the original CDs on this page as well. I wish that I could have shared better news, but I hope that this information is helpful for you in planning your research!
2024-04-16 · USA · marked as solution
Yes, it is relatively common for IPUMS USA variables that are continuous to also include values that are categorical. You can view the labels for these values using ipums_val_labels() or by viewing the INCTOT variable (e.g. if your data was named data you could do data$INCTOT). Information from both the catgry and codInstr tags are captured here.
These codes are also mentioned in the codes tab for each variable. The codes tab for INCTOT notes these as specific variable codes. This is most commonly used for missing and NIU data, but it is also used in other cases such as for bottom and top codes. For example, all respondents who report an INCTOT value above a certain threshold are assigned the same top code by the Census Bureau to preserve confidentiality (see the IPUMS User Guide page on threshold values). This is also mentioned in the codes tab on the website. We recommend that users review the codes tabs for all variables in their extract in order to code respondents correctly for their analysis.
2024-04-15 · Time Use
Hi Thomas!
I think that you might be a bit confused on the difference between these different weights. Usage of replicate weights (RWT06) does not preclude the usage of probability weights (WT06). In fact, it’s typically recommended to use both of these within a single analysis. Replicate weights are used for variance estimation and are produced through the Successive Difference Replication (SDR) method, which involves repeated implementations of the initial weighting algorithm. Probability weights on the other hand represent the probability of inclusion in the sample. Using replicate weights will affect your standard errors, but (unlike probability weights) not your point estimates. The way to specify this analysis in Stata is:
svyset [pw=wt06], sdrweight(rwt06_1-rwt06_160) vce(sdr) mse
Regarding your proposed method, while I believe the clusters and strata should be remunerated to be year-specific due to annual resampling, I am not aware of any formal guidance from BLS for how to handle these in pooled extracts. The Census recommended approach is specifically to use replicate weights for variance estimation.
2024-04-12 · International
This and other variable documentation for the Swedish censuses is available in the other source documents column on the enumeration materials page.
2024-04-11 · International
LABFORCE is a dichotomous variable identifying whether a person participated in the labor force. For the Swedish 1880, 1890,1900, and 1910 censuses, membership in the labor force has been defined on the basis of a person’s age and the values in the other HISCO variables. A person has been coded as a member of the labor force if they have an occupation string in OCCSTRNG, are more than 15 years old, have no value in the OCRELATE variable, and do not have the values 40, 51 or 52 in the OCSTATUS variable.
2024-04-11 · Health Surveys
Since URBRRL is provided for all respondents from 2019-onwards, SAMPWEIGHT is the correct weight to use in your analysis.
The additional complication with URBRRL (and why no weight is provided) is that it is a household-level variable, meaning that it can technically be analyzed either on the household or on the individual-level. For example, it can be used to estimate the percent of households in non-metropolitan areas which contained a person who ever had COVID (CVDDIAG). The NHIS used to provide a household-level weight (HHWEIGHT) for such analyses, which represented the inverse probability of household (rather than individual) selection into the sample. However, this variable was discontinued in the 2019 survey redesign when the survey stopped collecting data about all household members. This means that such household level analyses are not currently possible. However, you should not be concerned with using SAMPWEIGHT in conjunction with individual-level analyses that include URBRRL (e.g., calculating the share of people in non-metropolitan areas who ever had COVID). More information on weights is available on the IPUMS NHIS User Guide on Sampling Weights.
2024-04-11 · CPS
MOMLOC is a variable constructed by IPUMS that reports the PERNUM value of the respondent’s probable mother (including biological, step, and adopted) within the household. This will only allow for identification of mothers who reside in the same household as their children; MOMLOC is unable to distinguish between mothers with children whose usual residence is outside the housing unit and non-mothers (both are assigned MOMLOC = 0). Since sampling occurs by household, no information is available on children living outside the home.
If this is not a significant issue for you, then I also recommend looking into NCHILD (number of own children in household), YNGCH (age of youngest own child in household), and other family interrelationship variables. These may be easier to use since they report the data on the mother’s record without needing to link directly to the child’s record (as with MOMLOC). However, if you want to obtain information such as the ages of all children, you will still need to use MOMLOC to link all of these records. You may also try using the Attach Characteristics tool, which allows you to attach a characteristic (from the set of variables in your data cart) of a person’s mother, father, spouse, or household head as a new variable on the person’s record. While this links information on the mother to the child’s record (the opposite of what you’re looking to do), it may still be a helpful tool for your analysis.
2024-04-11 · CPS
The availability tab for EDATT notes that this variable appears in October CPS samples from 1976-2022. It likely shows that it is not available because you have not selected any of the October samples to add to your data cart. This variable is part of the School Enrollment/Education Supplement that is included annually with the October Basic Monthly Survey. The 2022 supplement data was released on IPUMS CPS in January 2024 and future supplements are expected to be released on a similar schedule. To add the relevant samples to your cart so you can include EDATT in your custom data file, click on the orange “Select Samples” button in the upper-left corner of the data browsing page, then click on the “Basic Monthly” tab; from there you can select samples either by month (e.g., October) or by supplement topic (e.g., “Education Supplement”).
You might also be interested in using SCHLCOLL, which reports current enrollment in high school or college and is available in every month of the CPS from 1989-onwards. Unlike EDATT, SCHLCOLL has a much narrower age range of respondents that it is fielded to. The universe tab notes that the question is asked of either persons aged 18-24 or 18-54 depending on the year of the survey, whereas EDATT is most commonly asked of all persons aged 3 and older.
2024-04-10 · USA
I received some more information that I can share with you. Overall, I suggest that you prioritize using the most recent and best versions of the data that are available. The version of the data prior to the January 2022 update were preliminary data and the now finalized datasets are improved versions of this preliminary data.
Your emphasis on comparability makes sense. However, you should note that all of the years are processed separately based on data availability and data transcription of the variables: 1900 is processed differently than 1910-1930, 1940, and 1950 (and vice versa for each dataset). Errors would only be duplicated within each of these samples, though each dataset is processed individually by HCP and enumeration instructions differ between censuses. Based on this, there is no reason 1940 has a similar issue as 1910-1930 unless evidence is produced to show that there are systematic coding errors. While the codes are generally comparable, researchers should consider the historical context and census enumeration procedures on whether comparing a particular industry over time is sound. Researchers should be cautious using 1950 because that is still a preliminary dataset and we are still improving occupation coding. Adjustments will still be made for 1950 since that is a preliminary dataset, but 1940 (and any version of 1940 data since April 2021) is based on the final version of 1940 so there are no more data adjustments being made to occupation except when errors are found.
2024-04-09 · International
OCSTATUS provides additional detail that is not available in OCCHISCO; these variables should be used in conjunction for proper interpretation of the occupation codes. The variable description tab for OCCHISCO notes that vague responses to the occupation question of the form “Works in [specified type of] factory,” such as “Works in cotton mill,” were grouped together with "laborers’’ and skilled workers in the same general industry. To differentiate between skilled workers, people who “worked in” a particular industry (skill level indeterminate), and laborers, you must use OCSTATUS. You can also access the original occupation response in OCCSTRNG
2024-04-05 · General
Thank you for bringing this issue to our attention. You’re correct that PERWT is incorrectly being used for these sample line questions (SLWT is the correct weight). I have passed this along to the IPUMS USA team and our group that works on IPUMS Abacus to determine if the tool can be modified to allow for different weights for the same variable depending on the year
2024-04-05 · General
You can access this data using either person level survey data available through IPUMS USA or published Census summary data tables available through IPUMS NHGIS. Both of these use the same underlying data source for years without a decennial census (i.e. the American Community Survey), but the summary tables provide more detailed geographical identifiers (e.g., country, census tract, etc.) while the microdata allows for more detailed cross tabulations of immigrants by other variables (e.g., sex, income, work status, etc.), though some cross tabulations are available through NHGIS as well.
In your case, it may be more straightforward to use NHGIS. We recommend that new users familiarize themselves with the website by reviewing the short video tutorials in the user guide and reading through the FAQ page. This will help you more efficiently use the Data Finder tool to filter through the different tables that are available. An example of a search that you might do would be to include State as your geographic filter, 2022 as your year, and Nativity and Place of Birth as tour topics filter. Table B05012 Nativity in the United States, will provide you with an estimate of the of native and foreign population for each state.
2024-04-05 · General
You can access this data using either person level survey data available through IPUMS USA or published Census summary data tables available through IPUMS NHGIS. Both of these use the same underlying data source for years without a decennial census (i.e. the American Community Survey), but the summary tables provide more detailed geographical identifiers (e.g., country, census tract, etc.) while the microdata allows for more detailed cross tabulations of immigrants by other variables (e.g., sex, income, work status, etc.), though some cross tabulations are available through NHGIS as well.
In your case, it may be more straightforward to use NHGIS. We recommend that new users familiarize themselves with the website by reviewing the short video tutorials in the user guide and reading through the FAQ page. This will help you more efficiently use the Data Finder tool to filter through the different tables that are available. An example of a search that you might do would be to include State as your geographic filter, 2022 as your year, and Nativity and Place of Birth as tour topics filter. Table B05012 Nativity in the United States, will provide you with an estimate of the of native and foreign population for each state.
2024-04-02 · CPS
I’m unsure based on your question whether you are asking about respondents who reported no income (i.e. reported $0) or those who did not report income (i.e. response left blank). HRPOOR is a recode of HEFAMINC (harmonized in IPUMS CPS as FAMINC) where a code of 2 indicates respondents reporting income “above 185% poverty or income not reported” (i.e. response left blank). Additionally, these variables report the combined incomes of all family members, not just the individual senior’s income. If this is not an issue for your analysis, then you can use FAMINC and its allocation flag QFAMINC to identify respondents who did not provide information regarding family income. While all blank cases of FAMINC are allocated (FAMINC = 999 are households that were not interviewed), QFAMINC = 5 (“Blank to allocated value”) and QFAMINC = 8 (“Blank to longitudinal value”) can be used to find respondent households that left family income blank.
If instead you’re asking about respondents who report earning $0, then you will need to use other variables to determine this. Since the vast majority of seniors will be earning some income in the form of Social Security, you might be interested in identifying seniors who do not earn any wage or salary income. In this case, you can use EMPSTAT to identify seniors who are either unemployed or not in the labor force as earning no wage/salary income. Finally, detailed income questions are asked of respondents in the Annual Social and Economic Supplement (ASEC) to the CPS every March. These include INCWAGE (total wage/salary income), INCSS (social security income), INCRETIR (retirement income), and other forms of income. About 25% of respondents to the December 2021 Food Security Supplement can be linked to their responses in the March 2022 ASEC. More information about linking CPS respondents is available on the IPUMS linking user guide.
2024-04-01 · USA
The historical team shared an overview of the types of changes between the two versions of the data with specific attention to IND1950, and took a closer look at changes to the publishing industry (ind1950 code = 459 “Printing, publishing, and allied industries”) to examine how these played out for a specific industry; they chose this industry based on the figures that you shared. There were very few changes in 1900 and no changes in 1940, so the historical team concentrated their focus on 1910-1930. Changes include adding/removing cases (fewer than 0.5% of records), assigning codes that were previously missing to valid industries (this is the largest share at 6-9% of records), and re-assigning codes that were NOT previously missing to a different industry (up to 3% of records). On the whole, the changes seem appropriate and improve data quality.
For the publishing/printing industry specifically, the new counts appear to be closer to the estimated sample counts (the occupation coding in the sample data is generally assumed to be high quality as there are many fewer cases, so it is easier to assign edge cases correctly), there was no evidence of state-level clustering of changes, and the only demographic trend for industry was that more younger people were coded away from publishing/printing to a different industry (but the overall sample was pretty small). Note that because of the similarity in the occupations “PRINTER” and “PAINTER”, a common change was coding cases away from publishing/printing and into construction. It is certainly possible that some of these should have remained as publishing/printing.
Below are additional details about the changes between versions for each sample year:
1910: Added 149k cases to industry code 459 (132k were previously “0 = N/A or none reported”) and 21k cases assigned from code 459 to something else; approximately 5k were recoded to “construction” (the painter/printer issue described above).
1920 : Added 176k cases to industry code 459 (158k were previously 979 (missing) and 30k cases assigned from code 459 to something else).
1930 : Added 207k cases to industry code 459 (187k were previously 979 (missing) and 23k cases assigned from code 459 to something else).
2024-04-01 · General · marked as solution
The variable CPUMA0010 provides a PUMA definition that bridges the 2000 and 2010 PUMA boundaries and allows for analysis of ACS data from 2005-2021. More specifically, CPUMA0010 aggregates one or more 2010 U.S. Census PUMAs into a singular ConsPUMA (consistent PUMA) that aligns (within a 1% population mismatch) with a corresponding set of 2000 PUMAs. The CPUMA0010 Summary provides the mismatch errors for each ConsPUMA. This page also provides a 2000-2010 PUMA crosswalk file that includes the block-based 2000 and 2010 populations for each intersection between PUMAs, as well as interactive maps and a boundary file.
2024-04-01 · USA
It appears that listing Beckley, WV (MET2013 = 13220) was simply overlooked when updating the documentation listing metropolitan areas when the new 2020 PUMAs were integrated into the data. We appreciate you bringing this to our attention. The code will be added to the codes tab for MET2013 and labels that identify this code as the Beckley MSA will be added to the data with the next release. Regarding Dover, Delaware, observations for this metropolitan area are available in the 2022 ACS. I’m attaching a screenshot that notes this information (the “X” denotes that it is available).
It’s difficult for me to comment on whether your standard errors are correct or not since this depends on the specific analysis that you run. Standard errors will likely be small when using large datasets such as the ACS, but they should not be 0. This suggests to me that the variable you construct has the same value for all observations (hence the differences between your observations and mean are all equal to zero). The Census Bureau recommends that researchers use replicate weights (REPWT for households and REPWTP) for standard error estimation. The IPUMS replicate weight FAQ provides sample code for incorporating these weights into analyses using a statistical package such as Stata or R.

2024-03-26 · CPS
You can find a crosswalk from NHIS occupation codes to Census Bureau codes in the NHIS codebooks that are released on the CDC website. The appendix to the 2020 adult codebook (the first year to code occupation based on the 2018 Census Bureau system) provides this crosswalk on page 621. Physical therapists are assigned to the Census Bureau occupation code 3160, which is then coded into OCC = 29 “Health diagnosing and treating practitioners” in the NHIS. This code groups physical therapists with other healthcare professionals (but not technicians) with Census Bureau codes from 3000-3270.
I was perhaps not entirely clear in my description of the data on NHGIS. While four-digit Census Bureau occupation codes are only identified on a national level in NHGIS, some aggregations of these codes are available on the county level. For example, the table B24010 Sex by Occupation for the Civilian Employed Population 16 Years and Over provides aggregate estimates of the number of men and women by county for 150 different occupational groups. This is not as detailed as the 565 codes that are available on the national level, but it more precisely identifies physical therapists than the NHIS does by grouping them with other therapists under Healthcare practitioners and technical occupations → Health diagnosing and treating practitioners and other technical occupations.
2024-03-26 · USA
We can work with you to provide an older version of the data if necessary, but it might be helpful to first take a more detailed look at these industry changes and see if we can provide information about the revisions that occurred and how they affected the data.
Could you describe broadly what changes you are seeing in industry coding between your samples? If you could also share a larger tabulation of IND1950, and IND itself if you have it in your older dataset, that would be particularly helpful. I’m also hoping that you could provide a bit more detail regarding your analysis so that I can understand the scope of these edits that are relevant to your research, including geographic, industry, and/or demographic criteria.
2024-03-26 · CPS
CPS microdata users often find that the results of their analysis differ slightly from published data tables. This discrepancy can be due to a variety of factors. In your case, the calculation of the median using $2,500 increments will affect these estimates. It can also be due to filtering using data that is not publicly available. For example, the estimated total number of Hispanic men 15+ according to the table you link is 24,380,000. However, when using the public CPS microdata and filtering by AGE and HISPAN, the corresponding value is 24,375,433. These values are very similar (with a difference of .02%) and one possibility is that the difference is due to the “People 15 years old and over as of March of the following year” criteria stated at the top of the page. Since the Census Bureau records respondents’ birthdays, but only releases their age in years, it may be that some respondents who are coded as being 15 in the 2023 ASEC were not 15 in March 2023. This can happen since data for the CPS ASEC is collected from February-April.
I also want to point out that the discrepancy between the median incomes that you are seeing for men is within the standard error estimate provided at the bottom of the table that you link to ($706). I suspect that if you were to recalculate the median income using the $2,500 increments that the table uses that you would also find that the median income estimate for women using IPUMS CPS data is also within the margin of error.
While there are benefits to using individual-level microdata, users should consider how important these types of deviations from official estimates are for their research.
2024-03-22 · NHGIS
You can find Census data tables summarizing the number of housing units by number of rooms on the tract level from 1960-onwards on IPUMS NHGIS. You can go back further to find tables with the total population and total number of housing units by tract from 1940-onwards (data on housing units for New York City tracts are also available for 1910 and 1920). For new IPUMS NHGIS users, we recommend reviewing the video tutorials in the user guide as well as the FAQ page to better understand the tools available in the Data Finder.
Changing administrative boundaries however make this type of long run analysis very challenging. Census tracts only appear beginning in 1910 for a select number of cities (eight in 1910 and 1920, 18 in 1930, and 60 in 1940) and these boundaries have significantly changed over time with tracts breaking up into smaller units as the population has increased and become more urban. To address this, IPUMS NHGIS provides tract level time series tables that use target-density weighting to interpolate Census block characteristics in order to provide tract level summary statistics standardized to 2010 tract boundaries. However, these tables are only available from 1990-2020. You might try to create your own crosswalk to extend your analysis back to 1940 using IPUMS GIS shapefiles of census tracts. These files can be added to an extract using the data finder tool. Aside from tract level data, IPUMS NHGIS does not have any decennial census summary data on levels below the county prior to 1970.
2024-03-21 · USA
As you mention, there was an update to the 1900-1930 complete count files on January 18, 2022. Revisions to the full count historical files often include updates to string variables; in the case of the January 2022 release of 1900-1930 data, this specifically included, among other edits, updates to the coding of string combinations of OCC/IND/CLASSWKR and other data quality checks that further refined these codes. These edits targeted strings that either were not coded or were coded incorrectly. These changes would also be reflected in the harmonized IND1950 codes that you are seeing.
You might try examining how respondents were recoded between your two datasets. HISTID is a consistent individual-level identifier that should be included in your older extract and can be used to merge respondents across your datasets to compare individual level changes in industry coding.
2024-03-21 · USA
The questionnaire tab for TRANTIME provides the exact text for this question. You can also find this question in the ACS enumeration form:
- How many minutes did it usually take this person to get from home to work LAST WEEK?
Minutes
The question is phrased using the qualifier “usually”, meaning that the respondent is asked to evaluate a set of travel times from the previous week to determine what the usual travel time was. The ACS is self-administered, meaning that respondents are liable to misinterpret any of the questions. However, additional instructions for this question were provided to respondents prior to 2017 (see #34 in the enumerator instructions). These instructions state to “enter a one-way commute time for this person’s usual daily commute from home to work last week. Include time waiting for public transportation or picking up passengers in a carpool.”
2024-03-14 · General
Yes, you may use these questions to measure contraceptive continuation. Responses to question 309a are recorded in the variable FPBEGINUSECMC and responses to 309b in the variable FPSTOPUSECMC in CMC form (number of months since January 1900). The consistency check in question 309d is not available via IPUMS PMA; this is an internal variable used by the original data providers only. Note also that FPSTOPUSECMC will equal 9999 for respondents who were still using a contraceptive method at the time of the survey. This is noted in the Codes tab for this variable.
While the questions in IPUMS PMA are worded such that the respondent should have been using the family planning method throughout the entire period from the given start to end date, there may be reason to suspect that respondents did not report periods when they paused in using this method. IPUMS DHS is another IPUMS data collection that also offers women months, where each observation is a month for a respondent woman, as a unit of analysis. While data is not available for Indonesia, the unit includes retrospective calendar data, collected for approximately 5 years before the month of interview for women of childbearing age, and includes information on pregnancy, birth, pregnancy termination, and, for some samples, contraceptive use. If you’re interested in exploring these data further, I recommend viewing the Introducing IPUMS-DHS Calendar Data webinar and the accompanying slides.
2024-03-08 · USA · marked as solution
The ACS 5-year samples are reweighted or “smoothed” when compared to estimates from the 1-year samples. The 2022 5-year Accuracy of the Data report explains that the pooled 5-year data are reweighed using the procedures developed for the 1-year estimates with a few adjustments concerning geography, month-specific weighting steps, and population and housing unit controls. Since the multiyear estimates represent estimates for the period, the controls are not a single year’s housing or population estimates from the Population Estimates Program, but rather are an average of these estimates over the period. This smoothing is not lost when collapsing by MULTYEAR, but estimates will differ slightly from the 1-year data due to these adjustments.
However, as explained in this Census Bureau blog post, estimates using the entire period of the 5-year file do not represent a midpoint or an average of the five 1-year estimates. Rather, they characterize the 5-year period as a whole. Assigning estimates from the 2016 5-year ACS to 2014 may not be accurate if conditions drastically changed during the collection period. If 2014 was an outlier year, this information would be swallowed up by the pooled data. Additionally, the Census Bureau strongly recommends against comparing estimates in overlapping 5-year periods since much of the data in each estimate are the same. The difference between the overlapping 5-year estimates in essence is measuring the difference between the non-overlapping portions. Rather, users should compare 5-year estimates that don’t have any overlapping years of data such as the 2016 5-year ACS and the 2021 5-year ACS.
2024-03-08 · USA
PUMA, CITY, and COUNTYFIP were released for the 2022 5-year sample earlier this week (see the revision history note for details). As mentioned, you should be aware that PUMA codes for households surveyed in 2022 (MULTYEAR = 2022) do not refer to the same area as PUMA codes for households in earlier years. The Census Bureau released two different PUMA variables to account for different census definitions of PUMA in the 5-year file (2010 and 2020). These variables have been combined into one variable, PUMA, based on MULTYEAR, in order to provide a single PUMA variable for multi-year samples. Unlike PUMAs, the codes for CITY and COUNTYFIP are consistent across time even if the specific cities and counties identified are not. Some counties and cities that are identified from 2018-2021 are no longer identified in 2022, while new counties and cities are available in 2022.
Also, a combination of CBSERIAL and CBPERNUM can be used to merge individuals between the 1-year and 5-year files.
2024-03-08 · USA
Standard geography variables (e.g. PUMA, COUNTYFIP, and MET2013) were released by IPUMS USA earlier this week (see the revision history note for further details). The revision history entry also notes that PWPUMA00 also references two different sets of PUMAs in the 5-year file. IPUMS has not yet updated PWPUMA00 in the 5-year file, which has delayed updates to PWCOUNTY, PWMET13, PWMET13ERR, and PWTYPE. We expect to be able to provide these variables before the release of the 2023 1-year ACS file in the fall, but I am unable to provide a more concrete timeline.
If you need the data sooner, you might try identifying PWCOUNTY for 2022 yourself using PWPUMA00 from the 2022 1-year file with the information and links I shared previously. By using the linked composition file and restricting it to unique combinations of state and PWPUMA00, you will have a list of Place-of-Work PUMAs that correspond to a single county. Respondents working in one of these Place-of-Work PUMAs in 2022 therefore can be identified as working in the corresponding county.
2024-03-08 · Global Health
I was just informed that there was indeed a technical issue with the IPUMS PMA website that prevented users from creating wide data extracts. This issue has now been resolved. My apologies for the inconvenience that this caused.
2024-03-08 · Global Health
I’m sorry to hear that you’ve been unable to request a wide formatted data extract. I was able to login to your account and create a wide data extract with the samples and variables that you had selected. You should have received an email that this extract (#7) is ready for download.
As you mention, anytime users edit the requested data format between cross-sectional, longitudinal long, and longitudinal wide, they must re-select samples and variables and add them to their cart. After clicking to revise your extract #6 and changing the data format to longitudinal wide, I re-selected all of your variables. After doing so, I viewed the data cart, and continued to the extract request page. The data structure section noted that the request was for a wide formatted file and I was able to request this file.
Since I wasn’t able to replicate this issue, I’m unsure of exactly what caused it. Users should begin with sample selection where they can specify that they want a wide file. Variables should then be added after the sample selection has been submitted. If you are using multiple tabs or browser windows for sample selection and variable selection separately, the new tab might not remember the sample selection or might interfere with selection.
2024-03-08 · CPS
The Census Bureau recommends using replicate weights (REPWTP) to calculate standard errors for estimates using CPS ASEC microdata. You will want to use replicate weights in conjunction with a probability weight (e.g. ASECWT, EARNWT) to generate estimates that are representative of your population of interest. EARNWT is the correct probability weight to use in any analyses that incorporate Earner Study variables. If you are only using ASEC variables without any of the Earner Study variables, you should use ASECWT for calculating person level estimates.
Regarding your question on restricting your sample, the IPUMS CPS User Guide on Replicate Weights provides sample code for running analyses that incorporate all relevant sample design information. In Stata, the recommendation is to use the svy, subpop() option rather than dropping observations. This will produce more robust standard errors, but will not affect your point estimates. For plotting graphs, I recommend referring to other online forums that provide more targeted support for Stata.
2024-03-08 · USA
The most granular geography identifier available in the ACS Public Use Microdata available via IPUMS USA is the Public Use Microdata Area (PUMA), which must contain at least 100,000 residents at the time of the corresponding census in order to protect respondents’ identities. While other geographic units are inferred in recent years (e.g., county, city, metro) and explicitly reported in some historical data (e.g., enumeration district), no geography variables smaller than PUMA are independently identified prior to 1990. To analyze data on the census tract level with publicly available data, you will need to access summary tables on IPUMS NHGIS. Based on your description of FARS data being available at the tract-level, it should be relatively straightforward to merge NHGIS estimates onto these data; the primary reason to use IPUMS USA instead of NHGIS is if the specific summary statistics you are interested in are not available in the published estimates.
2024-03-08 · CPS · marked as solution
When the Census Bureau implemented methodological changes to the Supplemental Poverty Measure in the 2021 ASEC, they also used the new methodology to update 2019 and 2020 so that the values would be comparable from 2019-onwards; this included releasing updated estimates and microdata files for these years. The public use microdata files implementing the revised methodology for 2019 and 2020 were released separately from the main ASEC data files. IPUMS CPS has not yet integrated the 2019-2020 files that use the updated methodology, meaning data for the 2020 IPUMS CPS version uses the old methodology and SPM measures are only comparable for 2021-onwards. While these updated files are on the IPUMS CPS team’s radar, there is no specific timeline for making them available. I have passed your interest in these files along to the IPUMS CPS team to consider as they prioritize upcoming work.
2024-03-07 · USA
MULTYEAR is the variable used to identify the specific year of survey in multi-year ACS/PRCS samples, whereas YEAR reports the last year of data included in these multi-year samples. In the 2016 5-year sample, all observations have YEAR = 2016, but have MULTYEAR values ranging between 2012-2016. Both variables come preselected in all multi-year ACS/PRCS data extracts. To obtain annual population estimates for each year from 2012-2016 in the 2016 ACS 5-year sample, you will want to collapse the data by MULTYEAR and then multiply by five (since the weights in the 5-year sample come scaled by a factor of five). Collapsing the data by YEAR would instead give you an estimate of the total population averaged over the 2012-2016 period (no requirement to multiply by five in this case)
2024-03-07 · Health Surveys
The IPUMS MEPS User Guide on Variance Estimation provides specific instructions and code for how to incorporate sample design data into your analysis. Researchers should use PSUANN to represent the impact of clustering (id) and STRATANN to represent the impact of stratification.
The correct IPUMS MEPS weight to use depends on the universe of the variables you are analyzing. Most questions in the MEPS are asked of all respondents and PERWEIGHT is the correct weight to use in analyses of these variables.
However, there are a set of questions, part of the Self-Administered Questionnaire (SAQ) and the new Preventive SAQ (PSAQ), that are administered to a subset of MEPS respondents (see SAQELIG for a description of who is sampled). The SAQ contains questions pertaining to satisfaction with health care, health status, non-specific psychological distress, and the Patient Health Questionnaire. The PSAQ, with one version for females and one for males, collects information about preventive care and contains many questions from the omitted Preventive Care section. Researchers should use SAQWEIGHT when analyzing data including SAQ or PSAQ variables (including when SAQ questions are analyzed in conjunction with other questions asked of all respondents).
Additionally, there is a self-administered Diabetes Care Survey (DCS) which includes a subset of respondents who reported ever being told by a doctor or other health professional that they have diabetes. Researchers should use DIABWEIGHT for analyses that include these variables.
If you’re unsure of which weight to use, you should consult the weights tab for your variables of interest, which specifies the weight that should be used with that variable in each year (e.g., the weights tab for RXNAME states that users should use PERWEIGHT when analyzing this variable on its own).
2024-03-06 · USA
That is correct. Due to ongoing work harmonizing and integrating of geographic boundaries based on the newly introduced 2020 PUMAs, PWPUMA00 is currently only available in the 2022 1-year ACS file and PWCOUNTY is not available in either of the 2022 ACS files. We are prioritizing a release of standard geographic identifiers for the 2022 ACS files, however there are plans to release Place-of-Work data for both of the 2022 samples in the future. I recommend periodically reviewing the revision history to see whether this new data has been added to the database.
2024-03-05 · CPS
Thanks for the suggestion–I can appreciate how this differentiation is helpful in your specific use case. Currently, we do not allow for case selection using MISH. However, I will share this request with the IPUMS CPS team.
2024-03-05 · General
“Additional households under 1990 definition” refers to housing units that would be considered group quarters under the 1970 classification system, but are households under the 1990 system. Similarly, “Additional households under 2000 definition” refers to housing units that would be considered group quarters under the 1970 and 1990 classification systems, but are households under the 2000 system.
The comparability tab for GQ provides information about the differences between these definitions:
-
For the period 1940-1970 (excluding the 1940 100% dataset), group quarters are housing units with five or more individuals unrelated to the householder. This means that households under the 1970 classification system contain fewer than five individuals unrelated to the householder.
-
Before 1940 and in 1980-1990, units with 10 or more individuals unrelated to the householder are considered group quarters. Based on this section, households under the 1990 classification system contain fewer than 10 individuals unrelated to the householder.
-
In the 2000 census, 2010 census, the ACS and the PRCS, no threshold was applied; for a household to be considered group quarters, it had to be on a list of group quarters that is continuously maintained by the Census Bureau. In earlier years, a similar list was used, with the unrelated-persons rule imposed as a safeguard. As a result, households under the 2000 classification system can contain any number of unrelated individuals as long as the household is not on the list of sampled group quarters (e.g. incarcerated individuals sampled in institutions).
Whether to count respondents with GQ = 2 or 5 as households is an analytic decision for individual researchers to make. I recommend reviewing the documentation in the comparability tab in further detail when making your decision. The tab cautions users that while they can make a completely comparable definition of household across multiple years, including the 1940-1970 period, by selecting only households coded GQ=1, this narrow definition may improperly classify as group quarters many large households with servants or boarders prior to 1940. For replicating published ACS and post-2000 decennial census estimates of households, you will want to include GQ codes 1, 2, and 5 in your analysis. You might also review Ruggles & Brower (2003) for a further in-depth discussion of how US Census household definitions have changed over time.
2024-03-01 · Health Surveys
I believe the issue you are encountering is caused by the specific extract structure you are using; this page provides a useful guide to the types of data structures that are available.
Each IPUMS MEPS variable is assigned to a particular record type (see RECTYPE) such as person, round, event, condition, medication-round, and medication-round fill. For example, demographics such as AGE and SEX are reported on person records, while information on medical visits (e.g. EVENTYPE).is reported on event records. However, demographic variables will not appear on event records; they will instead be reported as N/A. One option for users (the default option) is to request data that is rectangular on the person record. In this case, only variables recorded on the person record are included in the extract and each observation is an individual in a particular year that they were sampled. However, users looking to use other types of records such as event and condition records, can only obtain this data in a hierarchical format. In this format, each observation is not a person, but a particular record (e.g. event, condition, medication-round, etc.) for that person. A person record may be followed by multiple event records in the data. Since PSUANN is recorded on the person record, it will be reported as N/A on these event records and all other types of records (i.e. RECTYPE ≠ P).
2024-03-01 · USA
We are prioritizing on making CITY and similar geography variables available in the 2022 5-year ACS data since many users such as yourself rely on this variable. We hope to release some of these variables next week, however I am unable to provide a timeline for when this work will be completed. I recommend periodically checking the IPUMS USA revision history next week since any changes to the IPUMS database will be posted there.
When CITY is released in the 5-year file, you may notice that some cities that are identified from 2018-2021 are no longer identified in 2022, while new cities may become available in 2022. Moreover, some of your estimates may change due to changes in the composite identification error (reported in CITYERR). You can examine this change ahead of time by downloading CITY from the 2022 1-year ACS file and comparing codes with previous years (or by simply reviewing the codes tab for the variable for 2021 and 2022).
2024-03-01 · Health Surveys
I wanted to also mention that while respondents can be typically linked across two annual person records, respondents are in fact interviewed five times in a typical panel within this two year period. By requesting a data extract that is rectangular on round, hierarchical, or wide, and adding round level variables, respondents can be linked across up to five rounds (or across nine rounds for a COVID-era panel). You can select between these different formats on the extract options page. This guide further explains the types of data formats that users can request, while these video tutorials can be a helpful visual guide.
2024-02-29 · International
By default, our data are compressed (*.dat.gz). You will need to decompress or unzip them before using them. I recommend 7zip as a free decompression software for Windows and The Unarchiver for Macs. Additionally, the standard format for data requests is a fixed-width text file; we provide an accompanying syntax file to read the data into a statistical analysis package, such as Stata or SPSS. This blog post provides guidance on how to change your data request to a different format (e.g., a CSV file or a file that can be opened directly in Stata).
We also caution users against requesting extracts with a large number of samples and to instead focus on the particular samples that are required for the research statement provided in the data application. A compressed file with 100 samples can typically be a gigabyte in size and the unzipped version will be many times larger. With each sample potentially having tens of millions of observations (see sample details), a typical system running a statistical package such as Stata or R will not be able to process this much data. With .csv files the cap is even lower since Excel will display a maximum of 1,048,576 total rows.
2024-02-29 · Time Use
Yes, it is relatively straightforward to identify such cases in the ATUS with a few caveats.
First, the who variables (e.g. RELATEW and AGEW) ask respondents to identify who was in the room or accompanied the respondent during the activity. An adult who was present in the home at the time, but was engaged in other activities in a different room would not be included. Another point to be aware of is that secondary child care specifically refers to care of children (under age 13) that is done at the same time as another primary activity, such as cooking dinner or watching tv. Teenage respondents may also report primary childcare activities (ACTIVITY codes 0301xx, 0302xx, and 0303xx) if the main activity they were engaged in was caring for a household child under age 13. Users should be able to identify who the teenager was providing childcare to using the who variables. However, there may appear cases where a respondent reports providing childcare, but did not report the child as being in the same room or accompanying them in the activity. In such cases, you might use household composition variables to narrow down to who the teenager may have provided household childcare to. Finally, you should note that the ATUS only samples a single adult (15+) in each household regarding their time use. Respondents do not report childcare provided by other household members. As a result, only in households where the respondent was 15-18 years old can the type of childcare you describe be identified.
With these factors in mind, you can identify this type of childcare by creating and downloading an extract. You will need to first change your data structure to be hierarchical, then add the relevant who variables, household composition variables, AGE, SCC_HH_LN, and ACTIVITY if you want to also identify primary childcare. Your hierarchical extract will have separate who records nested under each activity record which themselves are organized under a person record and a household record. The household record will have data on household composition, the person record has information on the age of the respondent, the activity record will report the activity type and time spent on secondary childcare during the time of the primary activity, and the who records will report information on who else was present.
2024-02-28 · CPS · marked as solution
The CPS topic is a reasonable place to post this question; for future reference there is also a forum for general questions.
I can provide more detail on each collection if you have a particular research question in mind. This webinar also may be of interest as it provides an overview of how to study the health workforce using IPUMS data with a particular emphasis on how to study their health care utilization and expenditures using IPUMS Health Surveys. Broadly speaking, aside from the ACS and CPS, data on occupations is provided in the following IPUMS US data collections:
-
IPUMS Health Surveys (OCC in the NHIS and OCCCATRD in the MEPS)
Both OCC and OCCCATRD are less detailed than OCC in the ACS/CPS, reporting occupations using two digits rather than four. The NHIS identifies Occupational and physical therapist assistants and aides, while the MEPS lumps them into Service occupations.
-
IPUMS Time Use (OCC in the ATUS)
You might use ATUS data if you are interested in questions relating to time spent on different activities (e.g., work, sleep, education, etc.) by occupation. Since the ATUS is administered by the Census Bureau to a subset of CPS respondents, occupations are reported using the same level of detail as in the CPS. In fact, OCC_CPS8 is drawn from the final CPS interview.
-
IPUMS NHGIS
You might use IPUMS NHGIS to study the distribution of physical therapists on granular geographic levels such as counties, cities, and census tracts. Since summary tables are drawn from ACS data, the most detail that is available uses the same coding system as the ACS. However, this is only for national estimates. Tables using more granular geographies will aggregate occupation codes into more general categories.
2024-02-28 · General
I recommend reviewing the enumerator instructions available on the Questionnaires page on IPUMS USA as a place to start. For example, in 1930 the instructions state to “enter the name of every person” with the “'last name or surname, then the given name in full”. However, “where the surname is the same as that of the person on the preceding line do not repeat the name, but draw a horizontal line (-) under the name above.” Based on these instructions, enumerators were supposed to ask for each person’s surname, but only record it if it differed from the surname of the preceding individual. It’s conceivable that enumerators could have skipped asking for the wife’s surname, especially given how superfluous such a question might have seemed given prevailing norms around women taking their husband’s surname upon marriage. However, I’m unable to find any resources that give a sense of just how common this type of error was.
2024-02-28 · Health Surveys
Each person record should typically be able to be linked across exactly two years of the MEPS. What you are seeing is a result of the temporary introduction of additional sequential panels in the MEPS used to accommodate lower response rates during the COVID-19 pandemic. The panels (i.e. cohorts) that entered the survey in 2018 and 2019 remained in the MEPS for an additional two years and therefore can be linked across four different annual observations, or nine survey rounds. This change was temporary as panels entering the survey after 2019 will again be only sampled over two years just as before the pandemic. As a result, there are three different panels present in the MEPS in 2020, four in 2021, and three again in 2022 (data yet to be released on IPUMS). With the 2023 data release, you should expect that the MEPS will return to having two panels in any given year. For more information, you may refer to this article which further discusses the impacts of the pandemic on the MEPS.
You also mention that there are panel participants who are only surveyed once. I wanted to clarify that respondents who only appear in the data once are those who only responded to the survey in one of the two years that they were in the panel. The typical response rate to the MEPS is around 95%, though this rate fell significantly during the height of the COVID pandemic. More information about response rates and reasons for non-response are provided in the 2021 MEPS methodology Report. I hope my explanation helps clarify what is happening in the data.
2024-02-26 · USA
As the description tab for PWCOUNTY notes, the source PUMS files that IPUMS harmonizes do not directly identify place-of-work counties. IPUMS instead identifies place-of-work counties, where possible, from Place-of-Work Public Microdata Areas (PWPUMA00) that are reported in the original data files. Specifically,
PWCOUNTY identifies a county if and only if:
- it was coterminous with a single Place-of-Work PUMA; or
- it contained multiple Place-of-Work PUMAs, none of which extended into other counties.
2022 is the first ACS sample to use updated PUMA, MIGPUMA1, and PWPUMA00 boundaries from the 2020 Census. As a result, place-of-work counties have to be reidentified in the data. Moreover, the 5-year file requires special handling due to it using two different census definitions (2010 and 2020) of PWPUMA00 across the five years in the sample. As noted in the revision history, we are currently in the process of integrating geography variables, such as PWCOUNTY, that depend on these boundaries.
In the meantime, you may recreate PWCOUNTY for 2022 yourself using PWPUMA00 by following the identification rule stated above. This 2020 PWPUMA00 definitions page provides a relationship file between Place-of-Work PUMAs and counties. Since each Place-of-Work PUMA corresponds exactly to one or more 2022 counties, you can use the file to identify PWCOUNTY for respondents who reside in a county that is coterminous with a single Place-of-Work PUMA. When incorporating PWCOUNTY into the 2022 5-year ACS file, you should note that some counties will no longer be identified, while other new counties may appear in the data.
2024-02-26 · USA
The hyphenated components of NAMEFRST are not part of the name, but were codes used by Census enumerators. In particular,
-AB refers to persons temporarily absent from the home in 1930.
-H was not an official designation by Census, but enumerators were supposed to indicate the homemaker in the relationship to the household head column. Some of these may have been inaccurately recorded by enumerators in the name field.
-X was not an official designation by Census. It’s not exactly clear what this code may have referred to, but it appears to also have been a code inaccurately recorded by an enumerator in the name field as well.
2024-02-23 · General
The purpose of OCC1990 is to assign occupations throughout the IPUMS samples to a single occupation classification system to help researchers analyze occupation over time. This assignment process is complicated because occupation groups from a classification system in one year will not perfectly match into groups in the system for a different year. For example, math instructors (OCC1990 = 128) are identified in the 1990 Census with OCC = 128. However, in the 2000 Census, math instructors are not independently identified. Instead, the 1990-2000 Census Occupation Crosswalk notes that math instructors in this year are included in OCC = 220 (“postsecondary teachers”). Since particular subjects of instruction are not identified, there cannot be any respondents with OCC1990 = 128 in the 2000 sample.
IPUMS provides an in-depth discussion of the process used to create harmonized occupation and industry codes. Users should be aware that in producing these harmonized codes, IPUMS traced the proportion of each occupation as it broke out into more specific occupations or as it was combined with others into a more general occupation. A modal assignment rule was used where occupations were assigned into the code that a plurality of its members would have been coded into.
To take one example from the technical paper produced after the 1970 census: of persons coded as “Archivists and curators” in 1970, the Census Bureau determined that 60% would have been coded as “Miscellaneous social scientists” in 1960, while 40% would have been coded as “Professional, technical, and kindred workers, not elsewhere classified.” The crosswalk from 1950-1960 then shows that the plurality of persons – those coded as “Miscellaneous social scientists” in 1960 – would have been coded as “Miscellaneous social scientists” in 1950. Thus, OCC1950 codes all “Archivists and curators” in the original 1970 occupational classification to "Miscellaneous social scientists.
Researchers have the option to use other covariates (e.g. sex or education) to create their own occupation crosswalk to assign harmonized occupation codes instead of only using the total conversion rate.
2024-02-23 · Health Surveys
The MEPS has been a panel survey since the first cohort of participants entered the survey in 1996. You can read more about the MEPS panel design on this IPUMS user guide page. In 2018, the MEPS underwent a redesign that sought to reduce respondent burden by decreasing the frequency that certain questions were asked. However, this redesign does not affect the ability to link participants across their appearance in the panel.
As a test, I tried and was able to link respondents in 2010 to their 2011 record using MEPSID. I reviewed your data extract and followed the same general parameters, selecting person level variables and a Stata formatted file where observations are rectangular on the person level. I added the 2010 and 2011 samples to my extract. After downloading the extract, decompressing it, and running the .do file, I ran the following commands to identify duplicate (i.e. linked) values of MEPSID:
sort mepsid year
by mepsid: gen dup = cond(_N==1,0,_n)
When tabulating by dup, dup = 0 refers to respondents whose MEPSID value is observed only once and dup > 0 to those observed more than once. More specifically, dup = 1 identifies the first time a specific MEPSID value is observed and dup = 2 identifies the second time that this value is observed. Tabulating by dup and year, I find 18,127 observations with dup = 0 and 14,719 with dup = 1 in 2010. These figures make sense since about half of 2010 respondents are in their second year in the panel and are not observed in 2011. The other half with dup = 1 can be linked to observations with the same MEPSID with values of dup = 2 in 2011.
I hope this helps you figure out what is happening in the data and that you are able to link your observations. If you are still having trouble, please share more details on how you are linking your observations and I will take a closer look.
2024-02-22 · USA · marked as solution
BUILTYR2 provides the year (or general time period) that the respondent reported that their housing unit was built in. Since respondents often relied on their memory or estimation to arrive at an answer, this variable is particularly susceptible to response errors and non-reporting. However, it can be used to estimate new construction numbers. Users should be aware that small sample sizes will increase the standard error of their estimates. Researchers should use household weights (HHWT) in order to obtain statistics that are representative of the general population (see the FAQ for more information about weights) as well as replicate weights (REPWT) for empirically derived standard error of calculated statistics (see this user guide on replicate weights with sample code).
You will want to download an extract with household records only. This option is available from the extract request page after adding samples and variables to your data cart (see screenshot below). Requesting an extract with household records will include records of vacant units that are not provided with person-level extracts and increase your sample size. It will also restrict your sample to one observation per household, which is required for housing unit level analysis.
If you are interested in accessing geographically aggregated statistics (rather than individual microdata), you may alternatively be interested in accessing Census Bureau ACS summary tables on IPUMS NHGIS. You can filter tables by topic, including the year the housing unit was built, year, geographic area, and dataset using the Data Finder tool.
2024-02-22 · USA
Yes, you can aggregate PERWT to produce estimates of State-level employment. Which probability weight that you use will affect the standard errors of your estimates, but will not affect the aggregate sum of PERWT by State. While estimates on the State level might include enough observations such that standard errors are very small, I would still recommend using a statistical command (such as svy) to calculate weighted summary measures.
Note that your estimates will differ from official statistics published by the Bureau of Labor Statistics. To replicate published BLS labor force estimates, you will need to download data from the Current Population Survey (IPUMS CPS) and use COMPWT to increase reliability of estimates of month-to-month changes. Finally, you may also be interested in looking at IPUMS NHGIS, which provides access to geographically aggregated ACS summary tables produced by Census Bureau on a wide range of topics (including employment).
2024-02-21 · General
If you are only using CPS ASEC data (i.e. only one sample year), then there is no need to restrict on MONTH; a combination of YEAR, SERIAL, and FAMUNIT for both CPS-ASEC and Decennial Census data will be adequate.
I am not fully understanding how you are retaining families in 1950 where the first person in the family was also the sample line person. Using a combination of PERNUM = 1 and RELATE = 1 will not accomplish this without using SLREC. While RELATE = 1 identifies the household head, anyone in the household (with any value of PERNUM) could have been the sample line person. For additional context, census enumerators in 1950 interviewed household members and entered each person’s information on a line in the enumeration form. Each census page contains information on thirty individuals. Every fifth line on the census page was designated as a sample line, and persons falling on this sample line were asked additional questions (this is where the INC questions appear). Restricting the 1950 sample to households with a sample line household head will require you to drop families where the household head (RELATE = 1, or equivalently in the 1950 census PERNUM = 1) is not the sample-line person (SLREC = 1).
This approach retains all families where the head of the household is the sample line person. These families can be divided into two groups:
- Primary families (i.e., a group of individuals residing in the same household who are all related to the household head) where the household head is a sample line person.
- Secondary families (i.e., one or more groups of related individuals residing in the same household who are not related to the household head) where the household head is a sample line person.
Some of these secondary families may contain sample line respondents, but by definition, none of them will include the household head. To address these secondary families, you might try to determine yourself who you would call the family head for each of the secondary families by using contextual variables and retaining only families where the family head is the sample line person. Otherwise, you may choose to drop secondary families in multi-family units as well.
I stated in my previous response that HHWT was primarily constructed for household-level analysis, however HHWT does permit users to generate estimates for families in many of the Decennial Census samples that you reference. In particular, the 1960 & 1970 IPUMS samples are all “flat” samples, meaning that the probability of being included in the IPUMS sample is identical for all households (and by extension, families as well). Since income questions were asked of all respondents 14+ in these years, no additional adjustment to HHWT is necessary in order to use it as a weight for analyses of families. The same can be said of both the 1940 1% and full count files. Even though the 1% file is not a flat sample, HHWT is constructed using a method that allows for representative estimates for families.
However, in the 1950 samples, since income is only asked of sample line persons, additional adjustments must be made. When restricting your analysis to households/families where the household/family head is a sample line person, your subsample is actually a flat sample since each household/family has an equal probability of having its head be a sample line person. Moreover, this probability is equal to the probability of any individual respondent being a sample line person. In the 1% file (due to complicated sampling) this probability is 1-in-330. In the full count file, this probability is 1-in-5. If using the 1950 1% sample, you should therefore create a weight that is equal to 330 for all observations and run your analysis using this weight, restricting your sample to one observation per family/household as mentioned previously. With the full count file, your weight should equal 5. You may also want to compare your estimates between the two samples since there are known issues with reported income in the 1950 preliminary release.
Taking a quick look at your variable list, I’m seeing that you mention FWAGE2 and FBUSINC in 1950. While these variables may be helpful to check your aggregation of family income, you want to make sure not to double count income. For example, if both the household head and another member of the household/family were sample line persons in 1950 and reported wage earnings, you will have INCWAGE data for both respondents. If you then add FWAGE2 on top, you will be double counting the second respondent’s earnings. You mentioned not wanting to use FTOTINC since you wish to exclude transfers from income, but it may still make sense to use this variable for 1950 only (while constructing your own measure for other years) as it accounts for the sample line structure within families.
I hope my explanations are clear. Please let me know if you have any further questions.
2024-02-20 · General
I assume you are asking specifically about linking individual person records between the different IPUMS data collections. Please let me know if you had a different type of data linkage in mind.
IPUMS harmonizes and integrates data from a wide variety of surveys and censuses. Therefore, the vast majority of IPUMS data collections represent a unique sampling frame with respondents who are either unique to that survey and/or cannot be linked to any other IPUMS project. However, a few exceptions do exist.
Both the American Time Use Survey (ATUS, part of IPUMS Time Use) and the Current Population Survey (IPUMS CPS) are conducted for the US Census Bureau on behalf of the Bureau of Labor Statistics. A subset of CPS respondents are selected to participate in the ATUS; these respondents can be linked across the two datasets. This IPUMS user guide outlines two different methods that you may use. The unique IPUMS linking identifier CPSIDP is available through both IPUMS ATUS (CPSIDP) and IPUMS CPS (CPSIDP) and can be used to link respondents across these files.
Another exception is the National Health Interview Survey (NHIS) and the Medical Expenditure Panel Survey (MEPS), both available through IPUMS Health Surveys. However, linking respondents between these two surveys requires approval through a Federal Statistical Research Data Center (FSRDC). IPUMS does not process these applications and any data agreement would be between the user, the corresponding Federal agency, and the research institution.
2024-02-16 · USA
Hi Raheem,
I replied to your question through email, but want to follow up on your forum post so that other users who also have difficulty accessing the Slave PUMS data can refer here.
To input the data into Stata, you need to download the 1850 Flat Sample from the data download page (slave1850_1.dat.Z) and extract the file using a decompression program (we recommend 7-Zip for Windows and The Unarchiver for Mac). This will give you a slave1850_1.dat file. You will then need to download both the slavepums.do and slavepums.dct files and put all three files into a single folder. Then, open Stata and set the working directory to that folder and run the .do file. The .dct file is your data dictionary and the .dat file contains your data.
With a few minor edits, this procedure will also work for inputting any of the other Slave samples into Stata. For the 1850 and 1860 samples, you will need to edit the .dct file so that the first line refers to the correct .dat file. The file is currently configured to input the 1850 Flat Sample (slave1850_1.dat). For example, if you are looking to input the 1860 Flat Sample, you will want to change this reference to “slave1860_1.dat”. This can be done in any text editor such as Notepad. No edits to the .dct file are required for either the 1860 auxiliary file or the 1850 full count file. However, the full count “slave1850.do” file does require users to edit the preamble to provide the path for the .dct and .dat files as well as provide a location for the resulting Stata formatted (.dta) file to be saved.
The download page also includes command files for inputting the data into SAS and SPSS, though no command files are available for inputting the .dat files into R.
2024-02-15 · General
Your download speed for the linked full count file is likely slow due to the file’s size. I recommend decreasing the size of your data download. This can be done by selecting fewer samples, fewer variables, including only linked persons instead of all respondents, and/or by using the customize sample sizes tool to draw smaller random subsets of some or all of the samples in your extract (see instructions here).
You can also use the select cases tool on the extract options page to include only certain types of people or households (see instructions here). This will allow you to break your desired file into multiple extracts that will each download faster and then can be reassembled on your computer. However, users should be cautious in performing case selection on time-variant characteristics – such as age, marital status, or state of residence – since this risks excluding some observations for a person. An individual may be linked in a census year, but the observation will be dropped if they do not meet the additional selection criteria in that specific census.
2024-02-15 · USA
PERWT should be treated as a probability (a.k.a. sampling) weight since it is the result of random sampling from a population without replacement. Pweights represent the probability that an observation was selected into the sample from the population. Frequency weights on the other hand are used when you have multiple identical rows in the data; they also must be integers. This OARC post is a helpful guide to weights in Stata. Which type of weight you use (pweight, fweight, etc.) in Stata will affect your confidence intervals and standard errors, but will not affect frequencies or point estimates.
I’m not exactly sure what you mean by using PERWT as an indication for employment. EMPSTAT is the variable most commonly used to determine individuals’ employment status. You can run an analysis to see how your independent factor affects EMPSTAT with data weighted using PERWT. Once you weigh estimates of employment correctly, then you will have a nationally representative estimate. If you’re using Stata, you will want to svyset your data and then run your analysis using the svy prefix. You can also set weights in other ways. Try typing “help [command]” into the console and searching the help document for “weight” to see how to incorporate weights into a given command or line of code. Note that when using ACS data, replicate weights are necessary to estimate empirically derived standard errors or confidence intervals. Sample code for Stata, R, and SAS is provided in this IPUMS user guide. In Stata, you might run:
svyset [pweight=perwt], vce(brr) brrweight(repwtp1-repwtp80) fay(.5)mse
svy: reg empstat your_independent_factor
You may also find these IPUMS data training exercises helpful. They provide sample analyses with questions, answers, and code for a number of statistical software packages.
2024-02-15 · General
If you’re looking for data within a specific topic of interest, I would be more than happy to help guide you to some relevant variables. IPUMS does not provide a master data dictionary for all available variables. However, you can edit how variables are displayed in the extract system to show all of the available variables. To do this in IPUMS CPS, you can click on Select Data and then click on the Display Options button (see screenshot). You can then select to Show all groups together under variable groups. You might also select Display under Variables that are not available for the selected samples in order to display all variables regardless of whether they are available in the sample months that you selected.
The number of variables in IPUMS CPS is immense. If displaying all variables is not convenient, you might try another approach by browsing the CPS supplement guides which contain information on the types of questions that are asked in the various supplements as well as links to the survey codebooks.You can also search for variables using the search bar.
2024-02-13 · USA
OCCSOC codes in the IPUMS ACS samples are integrated into IPUMS USA from data using the original Census variable SOCP (see the 2022 PUMS data dictionary). You can add SOCP to your data extract on IPUMS by finding the year-specific variables in the Source variables tab for OCCSOC. The codes are already aggregated in the PUMS file that is released by Census in order to preserve confidentiality. As a result, the OCCSOC to SOC code relationship is the same as the SOCP in the original PUMS file to SOC codes
I am not exactly sure why the codes for 2000-2004 differ from those of 2005-2009 and why 2010-2012 differs from those of 2013-2017 in the crosswalk. I suspect that this is the result of an unanticipated need to preserve confidentiality by aggregating certain codes together. While they are based on the same SOC system, the different groupings reflect what is available in the PUMS data. This adjustment is done by Census in the PUMS file that IPUMS processes. You can find these aggregations and their codes in the PUMS data dictionaries. Thus, the IPUMS OCCSOC codes for each of the five periods map onto the SOCP codes released in the PUMS for each of the five periods.
I hope this answers your questions. You may find additionally this IPUMS crosswalk between OCC and OCCSOC in the PUMS helpful.
2024-02-12 · General
When running this analysis, you should be aware that the terms household and family are not synonymous in the data. Households refer to an address or dwelling where respondents reside and can include one or multiple families of related individuals. I assume that you are using FTOTINC in your measure of family income. If so, you should note that this value only includes the incomes of all members of one’s family as defined by FAMUNIT. This complicates your question regarding weighting since there is no family weight in the decennial census data. You might consider modifying your analysis to focus on households rather than families or use the provided household weight to weigh families with the caveat that the weight was not constructed for this type of analysis. In both cases, you will use HHWT as the weight in your analysis. You will also need to restrict your analysis to one member per household/family to not overcount these based on the number of respondents in each. For households, you can simply restrict your sample to PERNUM =1 after creating your income estimate. For families, you will want to restrict your sample to include only single unique combinations of SAMPLE, SERIAL, and FAMUNIT.
Regarding the 1950 decennial, I assume you want to use SLWT because you are using INCTOT, or another individual-level income measure. However, doing so will not give you a household or family-level estimate since these are individual income measures and were only asked of sample-line persons (see this IPUMS USA documentation for more information about sample line respondents in 1950). Your income variable therefore only includes income from respondents who were the sample-line person. Your process would therefore undercount household/family income and completely skip households/families where there is no sample-line person. Moreover, SLWT is a person-level weight designed to produce person-level estimates. One way that you might try to work around this is to restrict your sample in this year to households/families where the household head is the sample-line person (i.e. PERNUM = 1 & SLREC = 2). The households/families in your sample would then be broadly comparable, although you still would not be capturing total household/family income. This is the solution implemented by IPUMS for FTOTINC in 1950 where the variable is reported only for families with a sample-line household head. You would then follow the filtering and weighting procedure outlined in the previous paragraph by using HHWT.
Running this analysis using CPS ASEC data is much more straightforward since, as you indicate, a family weight does exist. FTOTVAL is also recorded for all persons. For a family-level analysis, you will still want to restrict your sample to single unique combinations of YEAR, MONTH, SERIAL, and FAMUNIT.
2024-02-08 · CPS
The post that you link to describes how to run an analysis in R using replicate weights. However, it does not appear that the tbl_svysummary function or the gtsummary package allow for replicate weights. I was able to find this StackOverflow post that specifically mentions the error message that you are seeing. The package author replies stating that “replicate weights are not currently supported.”
Therefore, you will need to run your analysis without replicate weights, or use a different package (such as srvyr as described in this user guide) that does accept replicate weights. Please note that replicate weights (i.e. REPWT, REPWTP) are different from survey weights (e.g. WTFINL, HWTFINL).
2024-02-08 · General
WKCURRJOB is not available for the 1986 Senegal sample. It does not appear that occupation was asked in the 1986 questionnaire of female respondents. This sample does include variables that report if the female respondent was currently working (CURRWORK) and on her husband’s occupation (HUSJOB).
In my previous response, I reported the values from the DHS variable V716 (“respondent’s occupation”) as per your inquiry; however, IPUMS DHS actually uses V717(“respondent’s occupation (grouped)”) to create WKCURRJOB. In the 2010-2017 DHS, the labels and counts for these variables are identical in the Senegal data, but that is not true for all years. Some samples do not include labels for V716 (1992, 2005), while others have different codes and labels between V716 and V717 (1997). Because IPUMS DHS uses V717 to create WKCURRJOB, I am providing a crosswalk using this variable below. I hope this is helpful. Note that you could also merge the original DHS data onto your IPUMS DHS extract (see details about linking keys from The DHS Program) to explore how V716 relates to V717 and WKCURRJOB.
Crosswalk from v717 to WKCURRJOB for the 1992 and 1997 samples:
- “Not working” (v717 = 0, coded into WKCURRJOB = 00)
- “Prof., Tech., Manag. ” (v717 = 1 , WKCURRJOB = 10)
- “Clerical” (v717 = 2, WKCURRJOB = 21)
- “Sales” (v717 = 3, WKCURRJOB = 22)
- “Agric-self employed” (v717 = 4, WKCURRJOB = 30)
- “Agric-employee” (v717 = 5, WKCURRJOB = 30)
- “Household and domestic” (v717 = 6, WKCURRJOB = 40)
- “Services” (v717 = 7, WKCURRJOB = 40)
- “Skilled manual” (v717 = 8, WKCURRJOB = 50)
- “Unskilled manual” (v717 = 9, WKCURRJOB = 50)
- “Other” (v717 = 10, WKCURRJOB = 96)
- “Don’t know” (v717 = 98, WKCURRJOB = 97)
- Missing (v717 = 99, WKCURRJOB = 98)
Crosswalk from v717 to WKCURRJOB for the 2005 sample:
- “Not working” (v717 = 0, coded into WKCURRJOB = 00)
- “Prof., Tech., Manag. ” (v717 = 1 , WKCURRJOB = 10)
- “Clerical” (v717 = 2, WKCURRJOB = 20)
- “Sales” (v717 = 3, WKCURRJOB = 20)
- “Agric-self employed” (v717 = 4, WKCURRJOB = 31)
- “Agric-employee” (v717 = 5, WKCURRJOB = 32)
- “Household and domestic” (v717 = 6, WKCURRJOB = 40)
- “Services” (v717 = 7, WKCURRJOB = 40)
- “Skilled manual” (v717 = 8, WKCURRJOB = 50)
- “Unskilled manual” (v717 = 9, WKCURRJOB = 50)
- “Don’t know” (v717 = 98, WKCURRJOB = 97)
- Missing (v717 = 99, WKCURRJOB = 98)
2024-02-06 · USA
I am not aware of any such crosswalk. However, you may find the crosswalk between DEGFIELD and HHES/CIP/NSF codes that Matt Bombyk shared in this forum post helpful. The only crosswalk between CIP and ISCED codes that I was able to find was one from this 1993 Department of Education report, but you might have more luck tracking down a more recent version.
2024-02-06 · General
Data for the variable URBAN comes directly from what is provided in the data shared with IPUMS; we harmonize URBAN by collapsing a variety of responses into this general indicator, but this does not provide a globally consistent definition. The comparability section of the URBAN metadata provides information on how urban/rural status was defined in each sample (you must select the sample(s) of interest in the data finder to see the sample-specific comparability information). You can also find the original uncollapsed data that goes into URBAN by referring to the Source Variables section.
You might alternatively be interested in POPDENSGEO1 and POPDENSGEO2, which report the population density per square kilometer of the first and second major administrative unit in which the household was enumerated. You could use these variables to create an alternative definition of urban/rural areas.
2024-02-06 · CPS · marked as solution
FSSTATUS is only determined for households who completed the Food Security Supplement (FSSUPINT = 1). Adding this additional qualifier to the universe statement should filter out all NIU responses. We will update the documentation to note this qualifier for the universe. The 2022 FSS codebook (pg. 12) provides additional information on non-interviewed supplement households. It notes that 9,858 households who were interviewed for the December 2022 CPS (HHINTYPE = 1) did not complete the supplement. The codebook also describes the criteria used to determine whether a household completed a partial interview.
When I tabulate FSHWTSCALE, the weight for food security scale data, for South Carolina in 2022, I get a total count of 5,106,244 persons and 2,203,295 households; this differs only slightly from official Census estimates and likely is due to the exclusion of people living in institutions and those on active duty in the armed forces from the CPS universe. The estimates for Spartanburg County were also similarly close to published estimates, though there may be a larger margin of error due to the small number of respondents on the county level.
2024-02-01 · General
The 2018-2022 5-year ACS Public Use Microdata Sample (PUMS) was released by the Census Bureau on January 25, 2024 (see the 2022 release schedule for reference). The IPUMS US microdata team is currently working to integrate the data into our harmonized database as quickly as possible. We typically expect this to take 3-6 weeks from the release date. Once the data are available, we will update the revision history promptly and send an email to registered IPUMS users. In the meantime, you may be interested in accessing the 2018-2022 5-year ACS summary table data, which provide geographically aggregated summary measures on select topics, through IPUMS NHGIS.
2024-01-31 · International
Hi Emanuel,
This definitely sounds doable in R. Once you’ve computed the age structure by geography and your demographic indicators, you can merge this data onto the shapefiles provided through IPUMS International using the COUNTRY, GEOLEV1, and GEOLEV2 codes as linking keys. The .zip file you download and extract includes a .shp shapefile that you can merge with these indicators in your dataframe using the sf package (see this StackExchange post for an example of how to do this).
2024-01-31 · General
I’m not sure which sample(s) you are interested in, but I can share the scheme that IPUMS DHS used to recode this variable in the 2016 Senegal sample and summarize any changes across schemes. You should note that occupational data already comes coded into broad occupation categories from the DHS. In 2016, the categories released by the DHS in v716 and their corresponding codes in IPUMS DHS variable WKCURRJOB were:
- “Not working” (v716 = 0, coded into WKCURRJOB = 00)
- “Professional/technical/managerial” (v716 = 1, WKCURRJOB = 10)
- “Clerical” (v716 = 2, WKCURRJOB = 20)
- “Sales” (v716 = 3, WKCURRJOB = 20)
- “Agricultural - self employed” (v716 = 4, WKCURRJOB = 31)
- “Agricultural - employee” (v716 = 5, WKCURRJOB = 32)
- “Household and domestic” (v716 = 6, WKCURRJOB = 41)
- “Services” (v716 = 7, WKCURRJOB = 42), “skilled manual” (v716 = 8, WKCURRJOB = 51)
- “Unskilled manual” (v716 = 9, WKCURRJOB = 52)
- “Other” (v716 = 996, WKCURRJOB = 96)
- “Don’t know” (v716 = 998, WKCURRJOB = 97)
For the 2010-2015 and 2017 samples, the only difference was that “clerical” (v716 = 2) was coded into WKCURRJOB = 21 while “sales” (v716 = 3) was recoded into WKCURRJOB = 22. If you are interested in a different or additional sample, please follow up, and I can provide you with the correspondence between the original DHS categories and the IPUMS DHS categories for those samples.
2024-01-23 · General
For estimates using geographically aggregated units such as metro area, I would recommend using IPUMS NHGIS. Unlike individual-level microdata in IPUMS USA, IPUMS NHGIS releases Census tables of summary statistics on various geographic levels for select topics and cross tabulations. This allows researchers to analyze data on more detailed geographic levels than what’s available in the microdata. New users should refer to the accompanying user guide, which includes short video tutorials on the Data Finder tool and other resources that are available on the website. To find the table that you mention, you will want to include Tenure and Mortgage Status and Household and Family Income as your topics filter, Core Based Metropolitan Statistical Area as your geographic level filter, and 2022 as your year filter to get the most recent data. The table B25119 Median Household Income in the Past 12 Months (in 2022 Inflation-Adjusted Dollars) by Tenure will give you the median household income for occupied, owner occupied, and renter occupied units by metro area.
2024-01-23 · General
The 3- and 5-year ACS files append all of the 1-year ACS files for their respective period into a single file and are helpful for increasing sample sizes when users are concerned about large margins of error in their estimates. Unlike these multi-year files, the 1-year ACS files allow users to generate annual estimates. There is usually no reason to mix these different types of files into a single analysis.
In the 1-year ACS microdata, PERWT is constructed so that the sample is representative of the total population for the given year (i.e. the sum of PERWT will equal the total US population for that year). The weights for the multi-year files have been adjusted to avoid totaling to the US population three or five times for the 3-year and 5-year ACS respectively. The 3-year ACS samples append three 1-year ACS samples, with the weights divided by three. The 5-year ACS samples follow the same pattern. You can compare total employment in different OCC1990 categories across ACS samples by summing up the PERWTs for each sample for observations that satisfy your criteria and directly comparing the results. Note that if you combine multiple one-year ACS files (e.g. pool the the 2011, 2012, and 2013 1-year files instead of using the 3-year file), you will need to adjust the weights to account for this pooling.
When you compare OCC1990 categories over time, please note that samples from 2018-onwards will harmonize occupation codes differently than samples from 2000-2017 due to the new Census occupation classification scheme. OCC1990 is a variable created by IPUMS and will match respondents in the new occupation scheme to the OCC1990 category that the plurality of respondents in this occupation group would have been coded into if they had reported the same occupation in 1990. You can refer to the guide on integrated occupation and industry codes for more information.
2024-01-23 · General
PWTYPE is available for the 1990 1% metro sample (see the availability tab). I assume that you are trying to reconstruct the variable for the 5% state sample. If so, you should be aware that while PUMAs and PWPUMAs (used to identify metro/city that respondents work in) in the metro sample generally follow the boundaries of central cities and metropolitan areas, in the state sample they generally follow the boundaries of counties or census-defined “places”. If a PWPUMA lies only partially within a metropolitan area or central/principal city, then the PWMETRO/PWCITY cannot be identified since it is unclear whether the respondent worked in an area inside or outside of the metro/city. Due to the differences in PUMA boundaries in the state sample, the populations of many metro areas are only partially identified in this sample, and in many cases, the unidentified portion is considerably large. Moreover, the identified portion of a partly identified metro area will often skew toward core populations and omit outlying communities. For these reasons, PWTYPE is not available for the 1990 state sample.
You may still try to create PWTYPE yourself. PWMETRO, for respondents who worked in a PWPUMA whose boundaries were fully within a metropolitan area, will identify the metropolitan area that they worked in. As mentioned above, this will omit respondents who worked in a metropolitan area, but cannot be identified as such due to working in a PWPUMA that included any area outside of the metro. To determine whether the respondent worked in the principal city of the metro, you will need to use data from PWCITY.
- Respondents who are identified as working in the city that is the principal city of the metropolitan area will be equivalent to PWTYPE = 1.
- Those who are identified as working in a city that is not the principal city of their metro area are equivalent to PWTYPE = 4.
- Those who are identified as working in a metro area, but are coded with PWCITY = 0000, are equivalent to PWTYPE = 5.
- The remaining respondents with PWMETRO and PWCITY = 0000 are either those who worked in a PWPUMA completely outside any metro area (PWTYPE = 7) or those who worked in a PWPUMA that straddles a metro area (PWTYPE = 9). Separating these two groups requires closer inspection of PWPUMA and METAREA boundaries. For this, you can use the 1990 state sample PUMA GIS files noting that 1990 PWPUMAs have a very simple relationship to 1990 PUMAs such that the first 3 digits of the 5-digit PUMA code correspond to a single PWPUMA. You can find the 1990 metropolitan area GIS files on IPUMS NHGIS by going to the Data Finder tool and adding METROPOLITAN STATISTICAL AREA/CONSOLIDATED METROPOLITAN STATISTICAL AREA [1990-2000] as your geographic level filter. The GIS files tab will show the 1990 and 2000 year files available for download.
2024-01-22 · CPS
There is no single variable that will identify respondents who are part of the ASEC SCHIP oversample. Observations in either of the two ASEC oversamples (Hispanic and SCHIP) are identified with the variable ASECOVERP, which assigns observations to the oversample if a household was included in the ASEC, but not administered the March Basic Monthly CPS. The variable is not always perfect in identifying these respondents; between 1976-1988 it is sometimes impossible to distinguish true oversample records from those which IPUMS is unable to link between the March Basic Monthly and ASEC files with confidence (for more information, see Flood et al., 2020). Observations in the Hispanic oversample also cannot be easily distinguished from SCHIP households; the latter includes Hispanic individuals and the former includes households with young children. However, dropping all observations with ASECOVERP = 1 will create a sample that excludes observations from both oversamples.
Alternatively, you might try to leverage the method used to assign respondents into the oversample. Flood & Pacas (2017) identify “split-path” assignment and month-in-sample 9 (MIS 9) assignment as the two methods used to draw respondents into the SCHIP oversample. Reverse engineering these methods to identify respondents who were included into the ASEC as part of the SCHIP oversample requires linking their ASEC oversample responses to responses from other months in the panel. This can be very tedious work and in some cases it might not even be possible to do. One case where this is possible though is outlined in the attached image. ASEC SCHIP oversample respondents can be linked to their ASEC record in the subsequent year if they were part of the split-path sample such that either the month before the ASEC (i.e. Feb) was their fourth month-in-sample (MISH) or the month after the ASEC (i.e. April) was their first month-in-sample. This is the extent of my knowledge on the matter, but I hope these resources are still helpful for your analysis.
Regarding your second question, HUNDER18 appears in IPUMS as the unharmonized variable UH_HH18_A1. A few notes in the variable description state that “comparisons of this variable with a created count variable (count if 0 lte age lte 17) indicate that hh18 values are too high in some years (2 percent of the cases in 1990); in some, the hh18 value is higher than total count of people in the household (numper).” The IPUMS variable AGE comes from a different person-level variable and therefore may not exactly match data from HUNDER18. Moreover, I noticed in your code that you did your summation within SERIAL. However, SERIAL is only unique to households within a given survey month and year. If you have multiple months and years within your sample, you will need to include MONTH and YEAR in your bys command.
2024-01-19 · IPUMS API
I want to preface by saying the API is a tool to access data; the API is not an analysis tool for frequencies and percentages. The online analysis tool applies weights (ASECWT is the sdawt for CPS samples in the SDA) to produce weighed estimates, but the frequencies displayed on the website are unweighed counts (e.g. see the WHYMOVE case-count view). However, you can use the data you obtain through the API to run your analysis in R. IPUMS provides a variety of data training exercises with sample code for analyzing CPS data in R, including code that incorporates weights into analyses. I recommend reviewing these exercises to understand how to adapt your code to account for weights.
2024-01-19 · ipumsr
Hi Stas,
I’m sorry to hear that you ran into this difficulty using the API. The source of this issue is that not all variables, for example OCC and IND, are eligible for case selection in our extract system. The IPUMS USA website automatically omits variables from the case selection option on the extract options stage if they are not eligible, but we have not yet implemented any similar mechanism to prevent users from trying to run case selections on these variables using the API. I have shared your post with our API working group who indicated that they would work on adding a more descriptive error code for this case.
2024-01-19 · USA
The ACS public use microdata sample that IPUMS harmonizes and releases does not report the county that a respondent household resided in. IPUMS USA imputes the county using PUMA, the smallest geographic identifier that is available in the data. As a result however, the variable COUNTYFIP will only identify a county if and only if it was coterminous with a single PUMA or if it contained multiple PUMAs, none of which extended into other counties.
The change that you observe in 2012 is the result of the redrawing of PUMA boundaries following the 2010 decennial census. The redrawing replaced PUMAs that were created following the 2000 decennial Census with PUMAs that maintained the required threshold of at least at least 100,000 residents at the time of the corresponding census. This change then affected which counties could be identified in the data. A table that lists counties and the years they are identified in is available for download from the COUNTYFIP variable description page. These 2010 census based PUMAs were used in the ACS data from 2012-2021, after which PUMAs were again redrawn to reflect population data reported in the 2020 decennial census.
2024-01-18 · Global Health
We communicated about this via email, but I have a small update and wanted to share the information more broadly on the forum. The variables you have referenced are country-specific variables which aren’t asked in every survey (these often have variable names beginning with S). While some are available via IPUMS DHS (e.g., S363 in the women’s questionnaire could be calculated using responses from the services obtained in the community health workers variable group (e.g. HCSEEKANTE)), these variables, on the whole, are unavailable through IPUMS DHS. While we offer a handful of these variables, we do not have any concrete plans to integrate additional country-specific variables at this time and many samples will be released without them.
I know this is likely not the news that you were hoping for. However, I hope this information plus my earlier note that IPUMS DHS data extracts can be linked to the original DHS files to add variables will help you determine how to best proceed with your research.
2024-01-10 · General
Replicate weights are currently available via IPUMS for the Annual Social and Economics Supplement (ASEC) of the CPS that is fielded in March of each year, but not for any of the basic monthly surveys. There is no specific recommendation for calculating standard errors using Basic Monthly CPS microdata. One method you might follow is Davern et al. (2006, 2007). They specify the lowest level of identifiable geography (STATEFIP) as the strata, and household (CPSID) as the PSU, and find that it improves variance estimation relative to the baseline of using just the weighted least squares variance estimator. You will need to have the survey and srvyr packages installed. You will also want to use the subset() option rather than filter() to retain sample design information. See sample R code:
data ← as_survey(data, id = CPSID, weight = HWTFINL, strata = STATEFIP, nest = TRUE)
subset(data, year >= 2019, year <= 2022, empstat >= 10, empstat <= 12, yngch >= 0, yngch <= 13)
As a reminder, in the CPS microdata each observation is a person. The filters you provide therefore identify individuals who are employed and have a child under 13 in the household; it does not identify other members of the household (e.g., the child wouldn’t be included in your current filters). Note that people are nested within households in the CPS, and not necessarily families (e.g., a household may contain one or more families). One way to restrict your file for household-level analyses is to filter on PERNUM==1; these analyses should use the household weight (HWTFINL) instead of the person weight (WTFINL). For family-level analyses, you will need to filter to one-person per family using FAMUNIT, SERIAL, MONTH, and YEAR; CPS does not provide a family weight for BMS data (you might choose to use the household weight for this). If you are interested in household- or family-level analyses, note that you might want to assign values for a “working family” variable before filtering to a single person per household or family because the first person may not be employed, but other adults may be (e.g., a household reference person with a child who is not employed but whose spouse is; filtering on PERNUM==1 before defining working families would not flag this family).
If you are open to other data sources besides the CPS, you might consider using IPUMS USA ACS data for your estimates. The ACS is an annual survey that includes more respondents than the CPS and also provides replicate weights for more accurate variance estimation. EMPSTAT as well as YNGCH are available. You might also access IPUMS NHGIS to search for official Census estimates in aggregated tables. While there isn’t a table for the specific criteria that you specify, you may get a lot of use out of it if you are willing to slightly modify your criteria. Using the Data Finder tool, you might filter geographic level to State, years to the most recent 5-year ACS (2018-202 2), and topics to Children in Households and Labor Force and Employment Status. Table B23010, Presence of Own Children Under 18 Years in Married-Couple Families by Work Experience of Householder and Spouse, will provide you with a state-by-state breakdown of the number of married-couple families by presence of own children under 18 years and the work experience of the householder and their spouse. The tables provide point estimates as well as margins of error calculated by Census statisticians.
2024-01-09 · USA
The US decennial census as well as American Community Survey (ACS) and Current Population Survey (CPS) data that IPUMS harmonizes sample respondents at their US residence. None of these sources include people who travel into the US for work and go back to their home in a different country at the end of the day. They do include temporary migrant workers who live and sleep for a period of time in the US, though the criteria for inclusion differs somewhat between these sources. For example, you might use the ACS variables EMPSTAT (employment stratus), STATEFIP (State), COUNTYFIP (County), YRSUSA1 (years in the United States), MIGPLAC1 (state or country of residence 1 year ago), and BPL (birthplace) to identify respondents who were born in Mexico, recently moved to San Diego County, and are currently working.
The Mexico 2010 & 2015 censuses available through IPUMS International do contain the variable PWRKMX (state or country of work), which reports the country that a respondent worked in during the previous week. More specifically, the questionnaire text notes that it identifies in what municipality, state, or country “the business, company or place where [the respondent] worked last week [is] located”. However, this doesn’t record the US county that a respondent worked in. You might restrict your analysis to respondent households in Baja California using GEO1_MX or even households in border municipalities using GEO2_MX, but again this will not guarantee that the individual commuted to a particular county (i.e. San Diego County specifically).
With a bit of googling, I was able to find border crossing statistics from the Department of Transportation. This does not identify the number of commuters, but you can filter by the port of crossing as well as the vehicle type. I wish I could have been more helpful and I hope you are able to find the data that you are looking for.
2024-01-09 · General
Eric, thank you for sharing the links to the Population Estimates Program. Your question on the PEP is a bit outside of my purview not only because IPUMS doesn’t provide any documentation on the PEP, but also because the interpretation of how differences in methodology affect estimates is an analytical question that researchers can approach in different ways.
Based on this Census training workshop presentation, estimates from the PEP and ACS have different uses. The recommendation is for the PEP to be used for “population and housing unit totals [and means] and demographic characteristics” while the ACS is for “social and economic characteristics” and “conducting statistical testing”. Unlike the ACS, the PEP does not include microdata or any social or economic detail. However, if your goal is to simply obtain a more accurate estimate of total net migration, it appears that the recommendation is to use the PEP. Since the ACS is a survey, the data include a margin of error (see the accuracy of the ACS data documentation). It is still not entirely unlikely however that the PEP’s estimate will be outside the margin of error for the ACS. As you suggest, this divergence could be due to differing methodologies that you may investigate further.

2023 · 166 replies
2023-12-28 · CPS
Demographic information is reported by the household respondent (HHRESPLN) for all members of the household, so this information is never provided via self-response unless it’s the household respondent’s demographic characteristics. Labor force information, on the other hand, is collected by each member of the household individually to the extent that it is possible; however, the household respondent may provide this information in cases where the individuals in the household are not available to report this information themselves. Therefore, LFPROXY is specific to the labor force information collected.
More broadly, there are a few things to keep in mind when determining the validity of linked CPS respondents. First is that not all links made using CPSIDP are valid; that is, some links will erroneously pair different individuals and assign them the same CPSIDP value due to migration, mortality, non-response, and recording errors (see Drew et al., 2014). New people can be added to households after the first month (e.g., new babies can be born) and people can leave households prior to the last month (e.g., through death, divorce, or migration). If the occupants of a residence move out, they are replaced in the sample by the new people who move in. MIGRATE1 might be used to identify some of these respondents. IPUMS CPS also allows users to drop all links with respondents with improbable changes in race (as well as age and sex) in the identifier CPSIDV.
You should also note that race codes have changed four times in the Basic Monthly Survey. These changes occurred between December 1988 and January 1989, December 1995 and January 1996, December 2002 and January 2003, and April and May 2012. You will need to determine how to map earlier responses to newer coding schemes for respondents who bridge any of these transitions (see Rodgers & Flood, 2023 for how IPUMS maps these).
I hope this helps. Please let me know if you have any other questions.
2023-12-28 · General
I checked your account, and I do not see any active registrations for any of the IPUMS data collections. To create and download a data extract, you will first need to register for the data collection that you would like to create an extract from. For example, to create an IPUMS USA data extract, you would first need to register to use IPUMS USA. Once you’ve registered, you can create and download data extracts. All of our data collections offer tutorials to help you get started. For example, IPUMS USA offers many helpful tutorials and an FAQ, including this tutorial on how to use the extract system and how to open an extract in SPSS.
Please note, I am not able to provide support for the SPSS statistical software package other than to help you troubleshoot how to read in the IPUMS data.
I hope this helps. Please let me know if you have any questions.
2023-12-28 · CPS
Thank you for your patience as we looked into your question.
I believe the differences you are observing between these variables is a result of different universes (i.e., whose responses were recorded for each question). HINSEMP indicates whether respondents had any employer-sponsored health insurance coverage during the previous year with data recorded for all persons, both policyholders and non-policyholders (see the universe tab for HINSEMP). INCLUGH is only asked of persons 15+ who had private (nongovernmental) insurance in their own name during the previous calendar year, so anyone who did not have the policy in their name is automatically coded “NIU” (not in universe) for this variable, even if they are covered by someone else’s policy. Similarly, GRPOWNLY indicates whether, during the previous calendar year, the respondent was the policyholder for group health insurance that was related to current or past employment. Someone who is coded as “no” may still be covered by an employee-sponsored plan, but will be coded as no because they aren’t the policyholder.
For a more comparable variable, you may be interested in GRPCOVLY or GRPCOVNW, which include all persons (i.e., policyholders and non-policyholders). However, these variables are only available for the 2019-2023 ASEC samples.
You may also be interested in GRPTYPLY, which is an alternative variable that is available for a larger range of years (1996-2023). This variable indicates the type of employer-based coverage the employee had last year: self only, family, or self plus one. The variable description provides additional information about related variables that may be helpful to you. If you chose to use this variable, I may suggest you use this instead of HINSEMP rather than in combination with HINSEMP to ensure you are using a comparable variable across time.
If you would prefer to use HINSEMP, you may also be interested in using HINSEMP via IPUMS USA, which provides the employer-provided health insurance variable for the American Community Survey (ACS) from 2008-present.
I hope this helps. Please let me know if you have additional questions.
2023-12-21 · USA
Hi Callum,
I replied to your email, but am sharing my answer here with a few extra details so that it can be helpful to other users who encounter the same challenge. Looking at your extracts, it appears that you’ve added filters using the select cases tool such that there are no available observations that fit your criteria. Specifically, you filter respondents to those with MIGPLAC5 = 200 (living in Mexico 5 years ago) in the 1970 1% form 1 metro sample. However, MIGPLAC5 = 200 is not a valid code in any of the 1970 form 1 samples (see the codes tab for MIGPLAC5). The comparability tab for MIGPLAC5 additionally notes that “for the 1940, 1970 Form 2, and 2000 samples, the specific foreign country where the person lived 5 years ago is reported; for the other samples, only “abroad, not specified” is given for persons living outside the U.S. and its territories 5 years ago.”
The two forms in the 1970 census include some of the same questions and some questions that differ between the forms. Form 1 was given to 5% of the population and form 2 was administered to 15%. An easy way to solve this issue is by changing your analysis to the form 2 respondents to the 1970 census.
Note however, that the same issue appears in the 1980 and 1990 samples as well (i.e. the country of residence five years ago is not identified in any samples for these years). You may instead try combining MIGPLAC5 = 911 (abroad, n.s.) with the variable BPL (birthplace) to identify respondents who lived outside the US five years ago and were born in Mexico. In this case, you will need to multiply PERWT by 2 for the 1980 sample, since, as noted in the comparability tab for MIGPLAC5 for 1980, “responses to questions about migration were coded for only half the persons included in the IPUMS.”
2023-12-21 · General · marked as solution
You should use the variable MIGPUMA1 (PUMA of residence 1 year ago); MIGPUMA (PUMA of residence 5 years ago) is only available for 1990 and 2000 samples. You should also combine it with MIGPLAC1, which reports the state that a respondent who had moved in the previous year moved from. You are correct that respondents with MIGPUMA1 = 05700, MIGPLAC1 = 048, AND (PUMA != 5700 OR STATEFIP != 048) are those who lived in Guadalupe county, Texas one year before the survey, but no longer did so at the time of the survey. A different way you might define these respondents are those with MIGPUMA1 = 05700, MIGPLAC1 = 048, AND MIGRATE1D != 23. By excluding respondents who moved within the MIGPUMA, you are only left with respondents who moved homes by leaving Guadalupe county/MIGPUMA. The ACS is fielded throughout the year, so the respondents may have migrated out of the county/MIGPUMA in 2020 or in 2021. You may be also interested in the recent release of the 2022 ACS 1-year file where Guadalupe county is contiguous with PUMA and MIGPUMA 05700
The 2021 5-year data append each of the five 1-year data files (2017-2021) into a single file. Your estimates using this file will therefore include all respondents who reported migrating within this 5-year period. The 5-year ACS file divides PERWT and HHWT from the 1-year files by five in order to make sums more easily interpretable as annual estimates during the five-year period. If you were to sum PERWT in the 5-year file for respondents who you identified as having moved out of Guadalupe county, your estimate will be the average annual out-migration from this county over this period.
I’m not sure what Population Estimates Program you are referring to. However, the county-to-county migration flow data released by Census are in fact derived from ACS data. However, estimates using the Public Use Microdata Sample (PUMS) file are not expected to perfectly replicate official estimates because the PUMS data are subject to additional sampling error and further data processing operations (see the 2022 ACS PUMS Accuracy of the Data report).
2023-12-15 · CPS
I’m glad to hear that you found the longitudinal ASEC extracts helpful for your research. The longitudinal files currently use the variable CPSIDP to link respondents across their appearances in the CPS panel. As the variable description for CPSIDP notes, “it is important to verify CPSIDP linkages with AGE, SEX, and RACE. In some cases CPSIDP will result in erroneous links, which are due to errors in the source data. Cases with the same CPSIDP value may also have inconsistent responses across samples due to errors on the part of the respondent or in recording the response.” These are the cases that you are finding displaying inconsistent age values. Note however that AGE in the CPS is top coded such that respondents from April 2004-onward who report being 80-84 are coded as 80 and those 85+ are coded as 85. Therefore, it’s possible for someone to increase their age by 5 years during their time in the panel if they began the panel at age 83 or 84. IPUMS has also recently begun providing the linking variable CPSIDV, which only makes links between those records whose SEX and RACE values do not change and whose AGE values change in expected ways over time (see Drew et al., 2014 for more details on CPSIDP and Rogers & Flood, 2023 for more details on CPSIDV).
I’m not exactly sure what you mean when you say that you found “482,717 apparent household address changes where the replacement household was not at the same address.” Respondent household addresses are not provided in the CPS PUMS file. IPUMS does offer the variable MIGRATE1, which indicates whether the respondent had changed residence in the past year. There will be a few cases where respondents moved into the housing unit within the past year and have taken the place of respondents who had previously been in the panel. However, when I linked 2022 and 2023 ASEC respondents, I found out that 98.6% of the 35,919 cases linked with CPSIDP reported migrate1 = 1 (same house) in 2023. Seeing 1/3 of the sample having a household address change sounds very strange to me and I would be curious to learn which variables and samples you used to come to this value.
2023-12-15 · General
Nothing specific comes to mind regarding comparing estimates from these two samples. A general note is that you will need to use weights (PERWT and/or HHWT) to make your estimates using the ACS samples nationally representative. See this FAQ on weights for more information.
2023-12-15 · General
It sounds like you may have selected only 2022 data and are seeing variable availability only for your previously selected samples. IPUMS CPS has displaced workers supplement data from January in every even year from 1984-2022. You can select previous displaced worker supplement data by going to the sample section page, clicking on the Basic Monthly tab, and checking either the boxes next to Jan in even years or clicking the Supplement Topics tab, then the Displaced Worker tab, and checking the boxes there for the samples you are interested in (see screenshots below). You will need to click Submit Sample Selections when you are done. I hope this helps guide you to the data.
2023-12-13 · General
It appears that you have an IPUMS account, but are not registered to receive data from any IPUMS projects. Without an approved account, you will not be able to save any extracts or obtain any data. Please email us at ipums@umn.edu so that we can figure out what happened and direct you to the correct registration form.
2023-12-12 · General
No worries, Chip. To answer your question, you can run the as_survey(), subset(), and svymean() functions that I provide from your excel file after editing the IPUMS extract without using ipumsr or the DDI file. You will still however need to load the survey and srvyr packages.
2023-12-11 · General
This is going a bit beyond what I am able to help with from user support. I’ve provided code for inputting data using ipumsr, using replicate weights in R, and subsetting the data since these are all part of the replicate weights user note. Your specification of the survey design in LIHTC_svy references REPWTP, when it should call for REPWT. This appears to be the reason for the error message. However, I cannot provide a full code review to confirm whether each function is correctly specified and whether it will give you the results that you are looking for.
2023-12-11 · General
There are several factors to take into account when using 2020 ACS data (see this user note on using samples with 2020 ACS data); the Census Bureau encourages users to proceed with caution when comparing data products containing 2020 data with other years. However, this was no particular guidance issued for comparing pre-2020 with post-2020 samples. The issues with response rates that the ACS encountered in 2020 were not significant enough in 2021 to warrant experimental weights or any specific note to caution users not to compare the data with other years. Therefore, whether you want to use pre-2020 samples in your project will depend more on your research question and methodology.
2023-12-11 · CPS
It is possible that Census ultimately does incorporate the results of the reinterviews into the PUMS data, but since there is no mention of this either in the chapter or in the PUMS documentation, I can only speculate on this account. I recommend reaching out to Census directly at dsd.cps@census.gov to confirm whether the reinterview data is or isn’t incorporated into the PUMS.
Census provides reallocation flags for a number of variables in the file; data for QEMPSTAT comes from the reallocation flag for labor force status, PXMLR. While Census uses a variety of methods to impute data such as logical and hot deck imputation, the method is not reported for the majority of allocation flags, but only for certain health insurance and disability variables asked in the ASEC (see for example HEALTH and its data quality flag QHEALTH). Code labels for BMS variable flags are provided in non-ASEC codebooks (see page 196 in this October 2021 codebook) and report the type of change rather than the imputation method used.
2023-12-08 · CPS
The current CPS technical paper has a chapter (4-2) on the reinterview process, including tables with reinterview statistics. The reinterview file is not released in the Public Use Microdata Sample (PUMS) file that we harmonize and likely can only be obtained through an RDC request. Reinterviews are a quality check for census field representatives (FRs); there is no mention in the technical paper that the reinterview leads to data being edited. I was also not able to find variables regarding reinterviews in the PUMS data dictionary. I suspect therefore that the results of the reinterviews are not incorporated in the data released by Census for EMPSTAT or QEMPSTAT; edits to EMPSTAT that are flagged by QEMPSTAT are usually allocations for cases with missing data (see the PUMS documentation for more information about allocation flags).
2023-12-08 · USA · marked as solution
The Census Bureau defines households in the ACS as including all persons who are “current residents” of the housing unit. This includes everyone who is currently living or staying at a sample address, except for those staying there for only a short period of time (two consecutive months or less). Under this rule, anyone who has been or will be living for two months or less in the sample unit when the unit responded (either by internet, mail, telephone, or personal visit) is not considered a current resident. More details about residence rules as well as a list of exceptions is provided in chapter 6 of the ACS Survey Design and Methodology Report.
Regarding college students, I recommend reviewing Isabel’s detailed response to this forum question: ACS Sampling of Off-Campus College Students. In short, college students who are not living at home at the time of the household interview will not be included in the household roster. They may be sampled separately in their college dormitory as part of the group quarters sample, but no information about their family will be available in this case. College students who are living at home at the time of the interview and will be staying there for at least two months (such as for summer break) will be included in their household roster. The ACS does not sample college dormitories during summer months.
2023-12-08 · General
It appears that you have not defined “design” before running this subset function. I’ve provided R code below that you may adapt for your research.
#Load packages
library(ipumsr)
library(srvyr)
library(survey)
#Set your working directory to where your .dat and .xml files are located
setwd("C:...")
#Read the .dat and .xml files in, entering the corresponding extract number you are using
ddi <- read_ipums_ddi("usa_[enter number].xml")
data <- read_ipums_micro(ddi)
#Define income qualified households and those paying above the tax credit maximum using using your criteria (I provide sample data here)
data$income_qualified <- 0
data$income_qualified[data$RENT !=0 & data$HHINCOME < 30000] <- 1
data$above_tax_max <- 0
data$above_tax_max[data$income_qualified == 1 & data$RENT > 700] <- 1
#Now define the survey design and the subsample
svy <- as_survey(data, weight = HHWT , repweights = matches("REPWT[0-9]+"), type = "JK1", scale = 4/ 80 , rscales = rep(1, 80 ), mse = TRUE)
sub_design <- subset(svy, income_qualified == 1 & PERNUM==1)
#You can generate the percentage of income qualified households paying above the tax credit max (and the replicate standard error) by getting the mean of above_tax_max
svymean(~above_tax_max, sub_design, SE=TRUE)
2023-12-08 · General
Yes, clicking on the plus sign under “Add to cart” will add the variable to your extract. You can also click on the variable name “REPWT”, which will lead you to the documentation page for this variable (there is an option to add the variable to your cart at the top of the variable documentation page as well).
2023-12-08 · General
REPWT (household-level replicate weights) and REPWTP (person-level replicate weights) are variables that you can add to your extract. They each provide 80 separate weights for all respondents (i.e. variables REPWT1 through REPWT80). See the IPUMS-USA replicate weights FAQ page for further details. Since you mention that you are estimating “the percentage of income qualified households” you will want to use REPWT to generate your standard errors.
In reviewing your analysis, I noticed that I missed an additional piece of code that’s required for generating household-level estimates. When running your analysis, you should restrict your sample to one observation per household to not overweigh households with more people. This is typically done by selecting only the first respondent in each household using PERNUM. Based on the R code that you shared, I believe this should go into your subdesign option:
sub_design <- subset(design, income_qualified == 1 & pernum == 1)
2023-12-07 · CPS
IPUMS has developed tools to simplify the process of linking respondents across CPS samples. One of these are longitudinal files, which link respondents across their two appearances in the Annual Social and Economic Supplement (ASEC). For example, records in the 2017-2018 linked ASEC file include all individuals who are in both the 2017 and 2018 ASEC files. Since respondents leave the CPS panel after 16 months, it is not possible to link respondents across more than two years of the CPS (i.e. you cannot link respondents from 2017-2023 because 2017 respondents were not interviewed in 2023). To add these longitudinal files to your extract, you will want to select longitudinal data files at the top of the Select Samples page. More information on these files is provided on the linked ASEC user note. IPUMS has also developed an Attach Characteristics tool (that can be accessed from the Extract request screen once you’ve clicked “view cart” and “create data extract”) which appends the respondent’s spouse’s income (INCTOT), marital status (MARST), or any other variable selected from the data cart as a new variable to the respondent’s line (mother’s, father’s and household head’s are also options). Currently, it is not possible to use both the longitudinal data files and the attach characteristics tool for the same extract. However, you can attach characteristics to a longitudinal file in any statistical package as long as you have added the variable SPLOC to your extract.
In Stata, you would run:
sort cpsid pernum_1
bysort cpsid : gen spouse_income_1=inctot_1[sploc_1]
sort cpsid pernum_2
bysort cpsid : gen spouse_income_2=inctot_2[sploc_2]
SPLOC reports the line number (PERNUM) of the respondent’s spouse. A person must be “married, spouse present” according to MARST in order to have a non-zero value for SPLOC, except for links between a householder and an unmarried partner. If you are only interested in married partners, you may identify and drop these links between a householder and an unmarried partner.
Note that the longitudinal ASEC files only include respondents who were surveyed in March. Given the CPS rotation pattern, only about 1/3 of respondents in any particular year will be surveyed in March (those entering the panel in December, January, February, or March). However, only respondents to the ASEC are asked about their personal income, so the ASEC is your best source for this data. If you want to analyze respondents in all Basic Monthly Survey (BMS) samples, you will have to do the linking yourself. IPUMS CPS provides extensive notes on how to accomplish this linking process in the 2021 Linking Workshop homepage, where you can also find Stata and R code. Note that the workshop will reference CPSIDP as the linking key and that users should validate their links; IPUMS CPS has since released the validated linking identifier CPSIDV. This new identifier only links respondents whose identities have been validated using SEX, RACE, and AGE and saves researchers the step of post-linking validation.
2023-12-05 · CPS
IPUMS CPS has no involvement in the assignment of food security status to CPS respondents; this work is done by the Census Bureau. Once the Census Bureau has released the data, the IPUMS CPS team harmonizes, documents, and releases the data as variables in the extract system. The variable FSSTATUS describes the process that the Census Bureau uses to determine food security status.
Food security is based on the number of affirmative answers to the food security questions and the presence of children in the household. Households are classified as food secure (high or marginal) if they report less than three food insecure conditions. Households with incomes greater than 185% of the poverty line who report no instances of food insecurity to two preliminary screening questions are also categorized as food secure (see FSSCREEN).
Households without children are classified as low food security if they report 3-5 food insecurity conditions and are very low food insecure if they report 6 or more food insecure conditions. Households with children are classified as low food insecure if they report 3-7 food insecure conditions, and very low food insecure if they report 8 or more food insecure conditions.
The CPS codebook provides user notes with more detail on how this scale is evaluated (starting on page 268). You might also try comparing your results to the adult and child raw scores (FSRAWSCRA and FSRAWSCRC) to see that they match. The raw score variables have a No response option as well, which may help you identify how the Census Bureau coded respondents who refused to answer food security status questions. If you still find a discrepancy after reviewing your findings based on this information, you can email us at ipums@umn.edu with a file that includes these cases (and all variables needed to calculate food security status) and we can take a closer look.
2023-12-01 · Global Health
Hi Stephanie,
This error seems to be referring to a bad DDI file. As a first step, I recommend redownloading and replacing the DDI file, being sure to follow the instructions here. If that doesn’t work, I would resubmit the extract request by clicking on the Revise button next to the extract on the My Data page and submitting with no changes to the request. You can then redownload and replace the DDI and data files from the new copy of the extract. If neither of these solutions work, please follow up here on the forum or email us at ipums@umn.edu and we can help you troubleshoot further.
2023-12-01 · USA
Hi Stephanie,
This error seems to be referring to a bad DDI file. As a first step, I recommend redownloading and replacing the DDI file, being sure to follow the instructions here. If that doesn’t work, I would resubmit the extract request by clicking on the Revise button next to the extract on the My Data page and submitting with no changes to the request. You can then redownload and replace the DDI and data files from the new copy of the extract. If neither of these solutions work, please follow up here on the forum or email us at ipums@umn.edu and we can help you troubleshoot further.
2023-11-30 · CPS
The IPUMS CPS link that you provide notes that WTSUPP was replaced by IPUMS in 2018 with supplement specific weights (i.e. CISUPPWT replaced WTSUPP for respondents to the Computer and Internet Use supplement). The weights were reallocated for all samples before 2018 and all subsequent weights followed this new procedure. While the Computer and Internet Use supplement questions (such as CIWRKCMP) have primarily appeared as a portion of the October Education supplement, these questions have their own sample design and therefore need to be analyzed using their own weights. Researchers analyzing respondents to the 1984 and 1989 Computer and Internet Use supplements should use CISUPPWT. You can find more information about this supplement in the sample notes.
Since the CPS microdata doesn’t include any sample design variables (strata or PSU clusters), running the analysis with weights in Stata or R is very straightforward. In Stata, you can add the option [pweight=cisuppwt] to the end of any regression and tabulation command. In R (using the ipumsr package), you should use the as_data function to enter the weights:
data ← as_survey(data, weight = CISUPPWT, nest = TRUE)
You can then run analyses using the summarise function. More sample Stata and R code is provided in the IPUMS training exercises.
To tabulate CIWRKCMP by SEX, EDUC (education), RACE, AGE, OCC (occupation), UNION (union status), STATEFIP (state of residence), and UHRSWORK1 (hours usually worked per week at main job) you will need to add the corresponding variable to your extract. Since IPUMS CPS data are individual-level microdata, the data will not be automatically sorted by category. Each record will be an individual respondent and you will need to tabulate the variables that you are interested in. Note that with analyses using the variable UNION, you will need to substitute CISUPPWT with EARNWT since respondents to this question form a subsample of the October supplement.
2023-11-27 · USA
You are correct that there aren’t variables that directly report work experience in the ACS data. Additionally, no information on the age at which education was completed is available. You might try to proxy for work experience by assuming the age a respondent entered the workforce using their education level. For example, a respondent whose highest level of education is 12th grade (EDUC = 6) might be assumed to have completed their education at age 18. More information on what ages researchers assume people enter the labor market is available on this StackExchange post.
One place you may be able to glean additional information about work experience from is the universe for OCC (occupation). This is because OCC reports the occupation not only for respondents who worked within the previous year, but also for respondents who had worked anytime in the five years preceding the previous year. You can also obtain this information in the year specific source variables for WORKEDYR, which report whether a respondent had last worked within the last 12 months, within the preceding five years, or had last worked more than 5 years ago or never worked at all.
2023-11-27 · General · marked as solution
This work is currently in progress. We expect to have the 2022 ACS available through the tool by the end of this week or early next week at the latest.
2023-11-22 · General
I wrote up this code based on the description of the project you provided; I have not written up similar code in R. You will have to write the code for this analysis and it will need to be modified according to your specific needs. Our team answers questions relating to documentation, but we do not provide code review. You might however find this forum post and the accompanying code helpful. You will need to use the ipumsr package to input and analyze IPUMS data. A guide on using the package, with additional vignettes, is provided on this documentation page.
2023-11-17 · General
In order to generate empirically derived standard error estimates with IPUMS ACS samples, you will need to use IPUMS provided replicate weights in a statistical software package such as Stata, R, SPSS, or SAS. Below is sample code you might run in Stata (the income and rent thresholds I used were arbitrary fill-ins for this example). Replicate weights are explained in further detail on this page, which also provides code for R and SAS. This will generate point estimates for your ratios, standard errors, and 95% confidence intervals. You will also need to add the variables REPWT, RENT, HHINCOME, NUMPREC, and BEDROOMS to your extract.
`svyset[pweight=hhwt], vce(brr) brrweight(repwt1-repwt80) fay(.5)mse'
*This line comes directly from the replicate weight user guide linked above. The only changes are that
*household weights (HHWT) replace person weights and household replicate weights (REPWT) replace person
*replicate weights since your outcome is on the household-level.

gen income_qualified = 0
replace income_qualified = 1 if rent != 0 & (hhincome < 30000 & numprec == 1 | hhincome < 50000 & numprec > 1)
*Use any criteria to determine whether a household is income qualified. The rent !=0 condition ensures that
*your analysis only includes rented housing units.

gen above_tax_max = 0
replace above_tax_max = 1 if income_qualified == 1 & (rent > 700 & bedrooms ==1 | rent > 1200 & bedrooms > 1)
*Use any criteria to determine whether the income qualified household is paying above the tax credit maximum
*allowed rent for the apartment size they occupy.

svy, subpop(if income_qualified == 1 ): tab above_tax_max, se ci
*Use the subpop option to restrict your analysis to only income qualified households without losing sample
*design information.
2023-11-16 · General
Thank you for sharing your experience and suggestions on how we can better improve documentation about uncompressing .gz files. This is something that we are looking into in order to improve user experience. I have shared your concerns with the microdata team who will evaluate and determine a solution that will address the issue.
In the meantime, I recommend sharing this blog post with students interested in using IPUMS data. The post was specifically written as a guide to help new users learn how to open IPUMS data, so I hope it can serve as a helpful resource.
2023-11-14 · General
I recommend reviewing these instructions for opening extracts as well as this FAQ question. Please follow up if you are still having difficulties after following these instructions.
2023-11-14 · General
Hi Chip,
IPUMS has implemented all three of the goals of this project as outlined in the redesign summary. You are correct that the objective of the project was to provide researchers with the tools to derive empirically accurate variances for estimates using IPUMS data. These tools are available in different forms across IPUMS projects from strata and cluster variables to replicate weights and sample code. If you are interested in calculating variance for estimates for a specific IPUMS project, please feel free to share more details about your project and I will explain the variance estimation process recommended by IPUMS using these tools.
2023-11-07 · General
Hi Alex,
There are currently no publicly available 1950 vintage Enumeration District shapefiles that I know of; you would have to make the file yourself using available maps. You can use the NARA ED map search tool to find the digitized ED maps. You can find the maps of Bronx EDs on this page. None of these maps are georeferenced. However, using these maps, you could work backwards from 1980 IPUMS NHGIS census block shapefiles by merging and splitting them to match the 1950 ED boundaries.
2023-11-03 · USA
Hi Ze,
Could you tell me a bit about your research project? Do you plan to use all of the available variables for your analysis? To answer your question, the only way to add all available variables to your extract is to manually select each variable or group of variables from the extract system. However, users should only add the variables that they require for the project specified in their application since using data outside of research and education purposes, as well as redistribution, is prohibited.
We would appreciate it if you could send us a quick email at ipums@umn.edu describing your research project so we can confirm that it adheres to our terms and conditions.
2023-11-03 · Health Surveys
The US microdata team will resume work on NHIS-LMF vintage variables in 2024 with plans to make MORTWT and MORTWTSA available for the vintage corresponding to the last time that MORTUCOD was updated (i.e. December 31, 2006) available in the first half of next year.
2023-11-02 · USA
From my review of the ACS codebook, it appears that ELEP can range between $3-$9,999 and is rounded and top coded. I was not able to find any cases of ELEP = 2 in any of the recent Puerto Rico Community Survey (PRCS) data. Would you be able to tell me for which years you’re seeing these values?
The value bbbb is supposed to represent NAs, while values within the mentioned range are valid responses. My understanding therefore is that ELEP = 4 represents respondents who either reported spending $4 on electricity in the previous month or whose reported value was rounded to $4. The values are occasionally allocated by census; these edits are documented in the editing procedure tab for COSTELEC and allocated cases are identified with the flag variable QCOSTELE. However, it appears that the majority of cases of ELEP = 4 were not allocated. Note that IPUMS harmonizes ELEP from the ACS and releases it in the variable COSTELEC.
2023-10-31 · CPS
For samples after May 2004, you can merge IPUMS CPS observations with the original Census data using only the variables HRHHID, HRHHID2, and PULINENO (LINENO in IPUMS) as linking keys. HUHHNUM is only necessary for linking samples prior to this period. I did encounter difficulty using this method with NBER files since these variables appear to have been edited there, but I was able to use and verify this linking method with the original Census data. I have reached out to the NBER for more details and can share if I find anything new regarding those files.
2023-10-30 · Global Health
NIU (not in universe) cases identify respondents who were not asked a particular question (see this FAQ response). The universe for each variable is provided in its universe tab. For example, you can see from the universe statement for CHEB, total children ever born, that men are never asked about the number of births that they have had during their life. Additionally, women who have never been married as well as those under the age of 15 or those 50 and older were also not asked about their total number of births in the Bangladesh 2014 survey. Note that the universe may be different for different countries and years. Moving to HWWHZWHO, the universe for the Bangladesh samples is surviving children under age 5 who were measured as household members and whose co-resident mothers were ever-married female survey respondents age 15-49 (with different years having slightly different age ranges for the co-resident mother).
As you discovered, the majority of NIU cases are for children who are no longer alive (i.e. not surviving children) using KIDALIVE. It turns out that the remaining 217 NIU cases are for children who were not measured as household members (i.e. LINENOKID = 00 “Not listed in household”). Not all the children represented in child records are also listed in their household’s record. You can see in the universe of HWWHZWHO that in samples from 2004 and onward, a requirement of being in universe is that the child was measured as a household member. That means that these kids did not usually live in the household and were not staying there now. It could be the case for instance that the child was living with another family member outside the household and was not available to have their weight taken. I recommend reviewing each component of the universe statement so that it is clear who has information on a particular variable and who is excluded since this may affect your analysis.
2023-10-28 · CPS
Missing information in the CPS is filled in by enumerators using one of three general methods: relational edits (inferring the missing value from other characteristics on the person’s record or within the household), longitudinal edits (using data from previous months’ responses), and hot deck allocation (assigning a missing value from a record with similar characteristics). All of the methods that you find will fit into one of these three categories. However, I do not have knowledge of exactly how these methods have changed over the time period that the CPS has been administered. For more information, I recommend reaching out to the Census Bureau with your questions. I will attempt to answer your questions to the best of my ability below:
-
The documentation does provide allocation flags for migration variables prior to 1995, but these have not been added to the IPUMS CPS database (see the 1994 codebook for allocation flags I-MIG1 & I-MIG4 on page 126). While the codebook provides different types of allocations when data on migration is missing (e.g. county and below assigned/allocated), details about the method are not provided.
-
“Allocated from matrix mob” means that values from questions provided by the respondent were used to impute the MIGRATE1 value stated in the data set, as opposed to assigning the value based on the response of other household members.
-
The 2020 ASEC codebook explains these allocation flags in the variable I-M5G2 (page 107). The “allocated from matrix” flags refer to allocation from answers provided by the respondent (as opposed to assigning values from other household members), with MIG1-MIG6 referring to different information provided by the respondent. Allocated from matrix MIG1 from instance refers to information provided by a respondent on their previous residence at geographic levels state and below, while Allocated from matrix MIG2 refers to information provided by a respondent on a foreign country that they previously lived in.
2023-10-24 · CPS
IPUMS recodes weekly earnings observations of 0 to 9999.99 (not in universe) in the BMS. Although 0 is the NIU code for weekly earnings in the ASEC, documentation indicates 0 is a valid response in the BMS. The US microdata team is currently reviewing whether to keep this recoding rule. In the meantime, you can find these 0s in the IPUMS data by adding the original unedited source variable(s) for EARNWEEK/EARNWEEK2 that correspond to the time period you are interested in.
2023-10-19 · Health Surveys
Unfortunately, work on vintage-specific weights had to be put on hold. While this is likely not the news you were hoping to get, you may be interested in using MORTUCODLD as an alternative to MORTUCOD. While MORTUCODLD provides less granular cause of death categories, the variable is available for respondents who provided sufficient data for linking (MORTELIG) and whose final vital status was judged deceased (MORTSTAT) as of December 31, 2019. That means that both MORTWT and MORTWTSA can be used for analysis of this variable.
2023-10-12 · General
Yes, all variables that are added to your data cart are included in a single extract regardless of whether they are household or person-level variables. In this regard, IPUMS allows users to select whether they want their data provided in a hierarchical data file or be rectangular on the person-level. The former provides separate household and person-level records within the extract each with their own variables, while the latter merges data from household records to person records within the household and does not retain the households as separate records. These format options are available in the extract request page once you’ve added samples and variables to your data cart, viewed your cart, and selected to create your extract. Simply click on Change under the Structure heading and select between these options (see screenshots).
2023-10-11 · CPS
Yes, the IPUMS CPS microdata contains 100% of the households that respond to the CPS and all of the individuals identified as residing in those households. This is documented in CPS technical paper 77, which states in chapter 1-4 that the public-use microdata files “contain records of the responses to the survey questionnaire for all respondents in the survey”. It should be noted, however, that about a third of households included in the household count are not actually interviewed. The total number of household records on the number of records page includes housing units that did not have any persons in the housing unit at the time of the interview. For example, in the August 2023 CPS, the 101,315 persons present all resided in one of the 42,831 interviewed households. The remaining housing units that make up the 69,446 figure in the number of records page includes 17,272 housing units where residents either refused the interview or were temporarily absent, and 9,343 housing units which were vacant, occupied by persons ineligible for interview, demolished, converted to storage or business use, or included in the sample by mistake. This is documented in the variable HHINTYPE and vacant units are directly identified in the ASEC in the variable GQ. Data on non-interviewed households is not available in person-level user extracts since there are no respondents to link these records to. In order to obtain data on non-interviewed households, users should select to get the data in a hierarchical format from the extract request page (after selecting to create their data extract),
2023-10-03 · USA · marked as solution
Thanks to Chris for digging this thread up! As Jeff says in the linked forum response, it is possible to pool together the three form one 1970 1% samples in order to create a 3% sample of the form one data since these samples are, for all practical purposes, mutually exclusive. This type of procedure is referenced on page 8 of the 1970 codebook. Since the 1970 samples are each a 1-in-100 national random sample, each observation has the same weight (i.e. flat weights) that does not need to be modified before running regression analysis. The only case where you would want to modify the weights is if you were to produce aggregate counts in your analysis such as the number of respondents who worked in agriculture in 1965. Since you’re appending together three samples that each have weights that sum to the total US population in 1970, all of your aggregate counts will be inflated by three. The solution would be to divide your weights (PERWT or HHWT) by the number of pooled samples.
2023-09-29 · USA
Hi Gabriele,
I was able to download and input the data from your extract #113 into Stata without encountering these missing observations. Regarding the difference in the file sizes, the Extract Request page reports the size of the file once it has been decompressed, while the 127MB refers to the compressed file size. I recommend reviewing these instructions for opening IPUMS extracts. Make sure that the downloaded .gz.dat file is decompressed; we recommend 7-zip for Windows users and the Unarchiver for Mac as free decompression software. I hope that helps!
2023-09-29 · USA · marked as solution
Unlike CBHHTYPE, which is provided by the Census Bureau, YNGCH is created using IPUMS family interrelationship links in MOMLOC and POPLOC. These links are not reported in the original data but are constructed by IPUMS based on a protocol that uses information from other variables and contextual information to determine probable family relationships; notably, they identify a householder and their unmarried partner as a couple and therefore both as parents to children assigned to either the householder or their partner via the protocol. The majority of cases where CBHHTYPE is inconsistent with YNGCH is with CBHHTYPE = 4 (Cohabiting couple household, NO own children <18), which makes sense given that the ACS definition of an own child does not explicitly include the child of an unmarried cohabiting partner whereas the IPUMS protocol is to link such cases.
2023-09-28 · USA
I do not currently have any information on whether new detailed race codes will be added to the public microdata to identify respondents who wrote-in an ethnic origin after checking the White or Black response box for race. This Census forum post states that a Federal Register Notice (FRN) will be released in the fall of 2023 to outline initial recommendations regarding replacing the ethnicity question with race, describe potential effects on data products, and release the estimated size of all ancestry groups using detailed race data. Since the forum post proposes identifying ethnic origins using information from race, it is likely that detailed race groups will be made available in future census data products. However, it is not currently clear what form this will take and whether these will be released in the public microdata or only be available in summary census tables. The forum post also states that there will be a public comment period. We try to share FRNs with data users via our newsletter and will keep following this so we can alert users to opportunities for comment.
2023-09-27 · International
HEADLOC reports the head’s person number (PERNUM) within the household. Beginning with the 1980 census, the household head is the first person enumerated in the household and is identified with PERNUM = 1. NATIVITY indicates whether the person was native-born or foreign-born. This information can be obtained for the 2000 census using the CITIZEN variable. Since only foreign-born persons are in the universe for CITIZEN, all respondents with CITIZEN = 0 can be classified as native-born, while respondents with CITIZEN > 0 are foreign-born. The data available in YRSIMM (years since immigrated) should be very similar to the IPUMS USA variable YRSUSA (years in the United States).
My knowledge is in IPUMS data and documentation; I do not have experience in status exchange theory and am unable to determine whether these variables are or are not applicable to your research.
2023-09-26 · International
You are correct that the 2000 U.S. census is also available through IPUMS International. However, applications to access IPUMS International data must be reviewed by our staff to ensure the proposed research projects are appropriate as per agreements with the original data providers. Account review and approval typically take about one week. While I will see if I can expedite your account approval, I recommend using IPUMS USA based on the timeline you mentioned. As you show in your screenshot BPL in IPUMS USA is the equivalent of BPLCOUNTRY in IPUMS International. You can similarly find the variables CITIZEN, YRIMM, EMPSTAT, and others from your screenshot on IPUMS USA.
2023-09-25 · CPS
Yes, you can still identify respondents earning less than the federal minimum wage by using HOURWAGE2 as long as their unrounded hourly wage is less than or equal to $7.22. I will see if we can make the language more clear on this.
2023-09-25 · International
Hi Youwen,
IPUMS USA provides access to U.S. decennial census microdata, such as the 2000 US census, while IPUMS International provides access to census and survey data fielded in other countries. I am seeing that you have been approved for access to IPUMS USA, therefore you should be able to access the 2000 U.S. census 5% sample there. If you have any further difficulty obtaining this data, I recommend referring to the IPUMS USA FAQ and video tutorials.
2023-09-25 · CPS
Due to hourly earnings between $0.08 and $29.99 being rounded to the nearest $0.05, it is unclear whether respondents with HOURWAGE2 = $7.25 are earning at or above the minimum wage ($7.25-$7.27) or whether they are earning below ($7.23-$7.24) since both cases are rounded to $7.25. This is what is meant by it is no longer possible to identify which persons are earning less than the federal minimum wage. For more information, please refer to the Census Bureau’s user note.
Hope that helps!
2023-09-19 · Health Surveys
It’s not surprising to me that some estimates would be more affected by the use of subpop() than others. IPUMS advises users to account for the complex sampling design of the NHIS appropriately, but it is up to individual researchers to determine how to run their analyses.
2023-09-19 · General
As Jonathan notes, in order to create the data, you would need to follow the process outlined in the methodology report. The report notes that computation of the center of population in 2020 used census blocks where a point within each block was automatically determined by a computer program. The population counts and internal points are available for download on the TIGER/Line web interface. Technical documentation on the files is provided. The report continues, explaining that the latitude of the center of population was determined by multiplying the population of each unit of area by the latitude of its population center, then adding all these products and dividing this total by the total population. To calculate the longitude, the longitude of each of the points was multiplied by the cosine of the latitude of the point and by the population associated with the point. These products were added and then divided by the sum of the product of the cosine of the latitude and the population figure for each point. There may be GIS functions that will do this calculation for you, though I recommend confirming that they use the same method as specified in the technical documentation.
2023-09-18 · General
IPUMS NHGIS releases center of population coordinates from data provided by the Census Bureau. Data is available for Guam and the Northern Mariana Islands for 2000 (under centers of population by county), but not for either the 2010 or 2020 census. These are the only sources that we are aware of for this type of data. You may be able to estimate the center of population using the provided methodology documentation.
2023-09-15 · Health Surveys
Removing observations from a sample that uses a complex survey design without running the subpop() option will result in losing information on relevant sample design parameters such as strata and clusters even if your analysis only focuses on this subpopulation. While your point estimates will be the same regardless, the standard error of your estimate will likely be different when including sample design parameters from observations outside of your subpopulation of interest. Adjusting the weights for observations outside of your analysis however is not necessary (unless using replicate weights). You can find further information in the Stata documentation on the subpop() option.
2023-09-15 · International · marked as solution
While the user support team is unable to provide analytical advice, this does sound like something st_make_valid() may be able to correct by making geometries conform to certain requirements (e.g. no duplicate vertices). I recommend reviewing the documentation to make sure st_make_valid() will do the adjustments that you intend. You may also be interested in using the IPUMS International world map shapefile that nests first and second-level administrative units.
2023-09-15 · General
Over the years, the Census Bureau has changed the ways it has categorized different occupations and industries. CPS samples from 1992-2002 use the 1990 census industry classification scheme while samples from 2003-2008 use the 2002 scheme. You can find the link to the different schemes on the IND codes tab. The code 770 refers to lodging places except hotels and motels in the former scheme and to construction in the latter. If you are looking to analyze workers involved in construction across these schemes, you will need to use the IND code 60 when analyzing pre-2003 samples. Alternatively, you might consider using the IPUMS harmonized variable IND1950, which consistently applies the 1950 industry coding scheme across all CPS samples. Specifically, IND1950 assigns IND = 60 for samples from 1988-2002 and IND = 770 for samples from 2003-onwards to IND1950 = 246.
The select cases feature only works with certain variables that need to be added to the data cart. If you would like to break your extracts by states, you can add the variable STATEFIP to your data cart and then go to the select cases option. If you are only interested in respondents with data on wages, then another option is to add the variable ELIGORG and select only respondents who are eligible for the Earner Study questions. Note that HOURWAGE is not available after April 2023. Researchers who want to compare hourly wages before and after this period should use HOURWAGE2 instead.
2023-09-12 · Health Surveys
This user note on variance estimation using NHIS data provides guidelines on pooling multiple years of data. Regarding weights when pooling samples, the simplest adjustment method is to divide the weight by the number of years of data pooled. The method you mention seems reasonable; you could try both and compare the results, though the two methods are likely to perform similarly well. Whether to adjust weights using all participants or just sample adults depends on your variable of interest and the types of estimates that you are looking to produce. If your outcome is only available for sample adults and you are looking to calculate estimates for this group (e.g. percent of US adults that have x), then you only need to use sample adults for your weight adjustment. In cases where your estimates are for the entire US population (e.g. percent of Americans that have x), then you will need to adjust your weights using all respondents. Note that the guide also provides recommended syntax for subpopulation analysis that does not compromise the sample design information. Rather than removing all cases with ASTATFLG != 1, the syntax allows researchers to run their analysis on this subsample in order to retain sample design information and compute correct standard errors.
2023-09-08 · USA
While IPUMS tries to group subcodes under their correct heading, this is not always possible to do with birthplace given extensive geopolitical changes over time. While the case of St. Pierre and Miquelon is somewhat straightforward (assigning it to a subcode under France), assigning respondents born in, for example, Czechoslovakia, to a particular modern-day country is not possible. Any codebook that combines regions into countries would also have to provide its own interpretation of the status of semi-independent regions such as Bermuda or Greenland. IPUMS therefore provides BPL general codes, but no particular guidelines reorganizing birthplaces into countries, leaving the determination to individual researchers themselves.
2023-09-08 · CPS
GOTWIC is the IPUMS harmonized version of the Census source variable WICYN. While the Census codebook states that the universe for WICYN is Adult female, the description tab for UH_WICYN_A1 (the IPUMS source variable for GOTWIC) provides further information, stating that discussions with the Census reveal that further restrictions apply to the variable. These restrictions however are not fully documented. As noted in the description for UH_WICYN_A1, recipients of WIC are limited to women ages 15 to 45 OR women ages 15 plus who live in the same household with a child 6 years old or less. However, with some testing of the 2022 ASEC data, I found the universe consisting of women ages 15 to 45 OR women of any age who live in the same household with a child 5 years old or less to exactly match the universe for this variable. This may not be the case for all years and, as indicated on the variable description tab, this variable should be used with caution. Since there does not appear to be an income criteria for being in the universe for this variable, it will not fully identify WIC-eligible individuals. However, you may review the eligibility requirements for the WIC and use variables available on IPUMS to identify eligible individuals.
I’m not quite sure about your second question, but SPMPOV classifies SPM family units as being below or above the poverty line based on the unit’s income, including transfers such as those from the WIC, and the federal poverty guidelines. SPMPOV includes benefits received rather than how many individuals qualified for WIC. Thus, though the Census Bureau assigns WIC participation at the household level and then designates as beneficiaries all eligible women and children in the households that report WIC participation, this does not affect SPMPOV. Rather, SPMPOV includes all WIC benefits (available separately in SPMWIC) that each individual received across the SPM family unit, and includes it in the SPM unit’s total income (SPMTOTRES) when determining its poverty status.
I am not finding any information mentioning imputation of SPMPOV. If you know of any documentation that mentions this, I would appreciate it if you could share it.
2023-09-08 · International
I’m glad to hear that you were able to figure it out. Thank you for sharing this solution with the community!
2023-09-05 · CPS
There are two points to consider here. First is that the estimates in the table you link to are annual averages, whereas the IPUMS SDA tool only includes a single month of data from the March ASEC each year. Second is that researchers should weigh their observations using the composite person-level weight COMPWT when replicating BLS estimates using CPS data. For further information on composite estimates, see BLS’s weighting overview and the technical documentation.
In order to replicate these estimates, you will need to create a personal extract that includes all 2022 basic monthly samples and the variables you mention in your post as well as COMPWT. As explained in this forum post, you will also need to divide COMPWT by the number the sample months in your data (i.e. 12). You can refer to this FAQ section and video tutorial if you encounter difficulty obtaining or analyzing IPUMS data.
2023-09-01 · USA
When mentioning the detailed race write-ins being added to the survey in 2020, are you referring to the redesigned race question that allows respondents to print their origins after selecting their race? While the question on race was changed in order to capture more information when people didn’t fully understand the instructions, the coded race categories themselves were not. The write-in responses are not released verbatim in the public use microdata, but are released as coded versions, in some cases with additional detail such as in the detailed race subgroups in RAC2P and RAC3P from Asian, Pacific Islander, and American Indian respondents; codes for similar subgroups are not released for White (e.g. German) or Black (e.g. Nigerian) respondents. To create RACE and RACED, IPUMS uses data from the publicly released variables RACE1P, RAC2P, and RAC3P (see the 2021 ACS PUMS data dictionary). You may be able to obtain the original write-in data by applying to access the restricted use data through an FSRDC. Alternatively, the variables ANCESTR1 and ANCESTR2 provide detailed ancestry information that may be comparable to the write-in origins in RACE.
2023-08-22 · USA
Currently, 1900 census data from Indian Territory is not available in the IPUMS USA full count files, but they are available in the 1%, 1.2%, and 5% samples for 1900 (you can identify these using STATEICP 53 & COUNTYICP 9010-9180). Responses for Indian Territory were primarily collected using the Indian schedules and not the population schedules used for the broader US population. We intend to release these records along with other territory data (including Alaska and Hawaii), but do not have a timeline for making these data publicly available. In the meantime, we can make these data available via a restricted use contract; however, I should be clear that these data have not been thoroughly cleaned and are available as strings rather than harmonized and coded files. Email at ipums@umn.edu to inquire about restricted use versions of the data and how to apply for access.
2023-08-22 · General · marked as solution
OCC1950 is an IPUMS-created harmonized occupation code that reassigns respondent occupations in the CPS from 1968-onwards into the 1950 Census Bureau occupation classification system. The composition of the 1950 occupation categories is described in detail in the U.S. Bureau of the Census, Alphabetic Index of Occupations and Industries: 1950. The occupation Computer appears three times in the index. The first appearance tells enumerators to assign computers to the occupation code 096 (technicians not elsewhere classified) if the industry observed is 226 (crude petroleum and natural gas extraction). Alternatively, if the industry is listed as Geodetic Survey, then they are assigned an occupation code of 092 (surveyors) and an industry code of 916 (federal public administration). Finally, all other appearances of Computer are to be given the occupation code 390 (clerical and kindred workers not elsewhere classified) and assigned to the industry that the respondent reported being in. Based on the article you linked, it appears that the type of human computers you are interested in would be coded to OCC1950 = 390 together with similar clerical occupations. If this classification is too broad, you might be interested in using IND1950 to further refine observations with OCC1950 = 390 by the industry that they worked in.
2023-08-16 · USA
Replicate weights and multilevel models are different procedures that account for clustered sampling. I am not aware of any methods that allow for multilevel modeling with the ACS replicate weights. Though the Census Bureau’s “Estimating ASEC Variances with Replicate Weights” document references the CPS ASEC, I recommend reviewing it to learn more about the construction of replicate weights.
2023-08-14 · International
Thank you for sharing your code last week. The IPUMS IT team was able to troubleshoot the issue that you were encountering with the case selection tool. You should now be able to run your API request. Please follow up if you still encounter these errors again. We really appreciate you bringing this issue to our attention!
2023-08-14 · USA · marked as solution
OCC2010 codes fall out of the data in cases where the Census Bureau changes occupation codes by aggregating or renaming occupations that causes occupations that could be previously identified with their own OCC code to no longer be identifiable. For example, the code for funeral directors (OCC = 320) was eliminated in 2010 when funeral directors were grouped with morticians and undertakers under a new occupation code (OCC = 4465). Since the OCC2010 code 320 no longer could identify respondents who were funeral directors, there are no observations of the code from 2010-onwards. Instead, as part of OCC code 4465, funeral directors are grouped into OCC2010 code 4460 (funeral service workers and embalmers) from 2010-onwards. They are put into this group since the majority of respondents with OCC = 4465 would have been coded to OCC2010 = 4460 if OCC = 4465 had existed prior to 2010.
A similar pattern is followed by gaming managers (OCC2010 = 330) when they are renamed entertainment and recreation managers and grouped into OCC2010 code 430 (managers, not elsewhere specified, including postmasters); geological and petroleum technicians, and nuclear technicians (OCC2010 = 1930) provide another example when they are renamed to environmental science and geoscience technicians; a final example is when counter attendant, cafeteria, food concession, and coffee shop workers (OCC2010 = 4060) are grouped with food preparation and serving workers, including fast food. You can chart these changes by creating your own crosswalk from the blog post as well as the occupation crosswalks available on the Census Bureau website.
To create a balanced panel, you may try to further aggregate occupations with 0’s with the occupation codes that they will eventually join. For example, adding all observations of OCC2010 = 320 to OCC2010 = 4460 and dropping the former code entirely.
Yes, some ACS PUMS OCCSOC codes are aggregations of SOC codes. This is because the SOC classification system is more detailed than Census is able to publish in the microdata due to privacy concerns. The crosswalks provided by Census should help you figure out which SOC codes map into the reported OCCSOC codes.
2023-08-08 · USA
IPUMS provides guidance for inputting and setting up survey data in R, but does not propose any specific method for calculating standard errors in R. Researchers should consult the relevant literature and practices within their field for recommended procedures. You might find this IPUMS forum post a good place to start. The subpop() will work with srvyr to help analyze subsamples of survey data.
2023-08-04 · International
Could you clarify if the issue is occurring when using the Select Cases option from the extract request page? It is definitely possible to select cases by age using the option, so I’m not exactly sure what is causing this error. Could you share which specific sample (country and year) you are trying to analyze that is giving you this error? Even better would be if you could upload a screenshot of the page with the error message. This will help me troubleshoot what the issue may be.
2023-07-28 · USA
IPUMS does not have guidance for manually computing standard errors. You can refer to the source code on github to see how the functions are defined in the package you are using. If svydesign() is giving you too much trouble due to large file sizes, you might try to subdivide your data into more bite-sized chunks. For example, you can use the select cases feature on the IPUMS website to download extracts only with respondents with your OCC1950 codes of interest. You might also try using the srvyr package. The package allows users to specify survey design factors and calculate standard errors for large survey datasets.
2023-07-28 · CPS
It is not entirely clear to me whether you are linking individuals across time periods or not; the correct weight to use will depend on this factor.
One possibility is that you are looking at one or multiple ASEC samples and retaining individuals who are members of an outgoing rotation group (ELIGORG = 1). In this case, no linking across time is occurring and your sample is defined by being a member of an ORG in any particular ASEC sample. EARNWT is the correct weight to use in this type of analysis. Using ASECWT would underestimate your population since your sample excludes ASEC respondents who are not ORG members.
Alternatively, you might be using the rotating panel structure of the ASEC to link ASEC and ORG responses of individuals across time periods. For example, you might link a respondent who was part of an ORG in April with health insurance information on the individual collected in March. Note first that ASEC respondents who are part of the ASEC oversample (ASECOVERP = 1) cannot be linked to their responses in other months. For respondents who can be linked, IPUMS provides several longitudinal weights for analysis. The correct weight depends on the samples being linked with the current guidance being focused on BMS and ASEC linkages.
2023-07-28 · USA
As you suggest, large differences in estimates may be due to sampling error. The fewer respondents who represent a certain category there are in the data, the higher the standard error of your estimate will be. This issue is exacerbated when using smaller samples such as the 1% files, particularly if combined with highly specific subpopulations. With some exceptions, it is preferable to use the larger sample (e.g., the full count instead of the sample in this case). Standard errors can be calculated to create confidence intervals for your estimates using statistical software packages such as Stata, SAS, SPSS, and R. For samples prior to 2005, the IPUMS analysis and variance estimation user guide recommends that users cluster their standard errors by household (CLUSTER) and incorporate STRATA into their survey design. For ACS samples from 2005-onwards, IPUMS provides replicate weights in the variables REPWT and REPWTP for users to derive empirically robust standard errors.
In this specific case, however, differences in estimates might also be due to different methods in coding occupations for the full count and the 1% samples. The samples and full count files were transcribed and processed at different times and using slightly different processes for variable assignments. In general, the smaller samples are likely to be of superior quality due to being transcribed with social science research applications in mind which often relies on principles or leaves documentation that make it easier to track down and make decisions about edge cases. However, with as detailed a variable as occupation, it’s unclear how much this extra refinement contributes to the difference because hand-checking occupation in either data file a challenge. I would expect certain general and unambiguous job categories, such as teachers, to be pretty stable between the two files. There may however be more coding variability in regards to social and welfare workers since they represent fewer observations and they don’t necessarily have job titles that are unambiguous.
I am sure you were hoping for a more definitive response, but hope this helps you contextualize differences between the estimates you are seeing and the strengths and challenges of the different data files in any given year.
2023-07-25 · CPS
Any single month of the CPS is meant to produce nationally and sub-nationally representative estimates when weights are used. Therefore, when you pool observations from the 2013, 2014, and 2015 ASEC, your estimates will be the sum of the estimates from each of the three individual years. You will need to divide your weights by three to produce an average for the three year period.
Another result of pooling multiple years of the ASEC together are repeated observations of the same individual across years due to the panel design of the CPS. While individual respondents can appear across multiple ASEC samples (e.g. ASEC 2014 & 2015), there are no duplicate respondents within any single CPS ASEC sample (e.g. within the 2013 ASEC). For reference, CPSID is the unique identifier for households in the CPS and CPSIDP is the unique identifier for individuals in the CPS. Each individual within a household will have the same CPSID value. Note also that all participants of the ASEC oversample (as indicated by ASECOVERP) will have a CPSIDP value of 0 since they cannot be linked across samples. Whether to retain repeated observations of the same individual across years is up to the researcher; it is worth consulting the literature in the field to see what others have done with an eye towards the specific application.
2023-07-14 · USA
Regarding analyses with subsamples of the data, IPUMS recommends using the subpop() option in Stata after svysetting the data. The user guide notes that users must first define the subpopulation with a dichotomous variable coded 0 for all cases that should be excluded from the analysis. The decision of which method to use to generate standard errors is ultimately up to the researcher. The Census Bureau in their design and methodology report however notes that users of the ACS PUMS files can compute the estimated variances of their statistics using one of two options: (1) the replication method using replicate weights released with the PUMS data, and (2) the design factor method. The report states that in general, the replication method produces significantly more accurate variance estimates and is strongly recommended over the design factor method whenever practical. This paper offers some additional insight into different methods of calculating standard error with IPUMS data products and how the outcomes may vary.
2023-07-12 · Health Surveys
Yes, SAMPWEIGHT is the correct weight to use when estimating the total population of 18+ people in the U.S. diagnosed with bladder cancer at age 13 using CNBLADAG. This is because this question is only ever asked of sample adults aged 18+ who were ever told they had bladder cancer.
Note however that the small number of survey respondents who ever reported having bladder cancer (CNBLAD) makes producing such an estimate particularly difficult. For example, in the 2021 NHIS not a single respondent reported being diagnosed with bladder cancer at age 13. This does not mean that there wasn’t a single adult in the entire U.S. in 2021 who had been diagnosed with bladder cancer at age 13, but that this was rare enough that none of the approximately 30,000 sample adults in the 2021 NHIS fell into this category. Such precise statistics can be difficult to estimate with survey data due to the few number of respondents satisfying the criteria. The results is a large standard error
There are several approaches that you might consider in order to increase your sample size to reduce the standard error of your estimate. These include grouping multiple age brackets and pooling data from multiple years of the NHIS (in which case you will need to divide SAMPWEIGHT by the number of years pooled). Aggregating by cancer types (e.g. genitourinary cancers instead of bladder cancer only) might also help.
2023-07-07 · General
You can reach out to the Bureau of Labor Statistics by submitting your CPS question through this form.
2023-07-05 · USA · marked as solution
Generally speaking, you can measure poverty levels on the individual, household, family, or any other level depending on which is of most interest to you. POVERTY expresses the ratio of the sum of incomes of all family members over the poverty threshold established by the Social Security Administration for the specific family size and type (see these tables for specific threshold values). For example, if a family unit consists of three people (including one related child under 18), their poverty threshold would be $23,556 in 2022. Suppose the combined incomes of all family members was $50,000. Then the value of POVERTY for each individual in that family would be $50,000/$23,556 * 100 percent, or 212. Each member of the family will have the same value for POVERTY regardless of their individual income.
While determining where an individual is relative to the poverty line requires knowledge of family size and income, this does not mean that the family must be the level of analysis used. In fact, it appears that individuals are the unit of analysis in the shared table based on the subtitle net interstate migration among adults ages 18-64. Therefore, to recreate the table, you would need to identify individuals who migrated in and out of California using MIGPLAC1 and STATEFIP and subdivide them into groups using POVERTY. In this case, no filtering by PERNUM/FAMUNIT is required; you should then weight your estimates using PERWT.
If you wanted to generate an estimate on the family level (i.e. net number of families migrating to/from California), you would restrict your analysis to one respondent in each family. Restricting to FAMUNIT = 1 does not accomplish this for two reasons. First, since FAMUNIT indicates which family within the housing unit each person belongs to, all individuals in the first family in a housing unit will have FAMUNIT = 1. Therefore, this would include all members of the first family. Second, this restriction will omit members of any second, third, or subsequent families within the same housing unit. It’s therefore necessarily to restrict the sample to one individual each with a unique combination of FAMUNIT and SERIAL (and SAMPLE if you are including multiple years in your analysis). In this case, you would also need to create a family-level migration variable. Since there is no specific weight associated with families, you will also need to decide yourself how to proceed based on the literature. According to Chapter 11 of the ACS Methodology page, the Census Bureau uses housing unit weights for family-level estimates. You can also run this analysis on the household level. However, households may contain multiple families with differing values of POVERTY. Whether to drop these secondary families and restrict the analysis to individuals with PERNUM = 1 or not is up to the individual researcher.
2023-06-28 · USA
The problem these researchers appear to be trying to solve is that the data does not report what commuting zone a sample household resided in and that the smallest geographic unit that is identified, public use microdata areas (PUMA), are not contiguous with commuting zones. The code you shared therefore appears to estimate commuting zones as weighted combinations of the PUMAs they contain. However, this is not an issue when constructing state-level measures since PUMAs do not cross state boundaries. The state that a respondent household resides in is identified in the variable STATEFIP.
2023-06-28 · General
This is generally the correct method to use with the caveat that each month of data is intended to weight to the US non-institutionalized population. If pooling multiple months of data, your point estimates will be higher by the number of samples pooled. Therefore, if you’re using 12 months of basic monthly survey data (i.e. no ASEC data) then you should divide WTFINL by 12 before summing up the weights of employed individuals by state and industry.
If you use ASEC data for your estimates instead, then no division is required since this is a single sample. ASECWT should be used for person-level estimates using ASEC data. However, for your research question, I recommend pooling multiple months of basic monthly data in order to increase your sample size. Due to the detail available in industry codes, some industry x state products will have few observations and their population estimates will therefore exhibit high standard errors. Increasing your sample size may help you avoid this issue.
2023-06-28 · Health Surveys
PERWEIGHT represents the inverse probability of selection into the NHIS sample and should be used with variables for which information was collected about all persons. Meanwhile, SAMPWEIGHT represents, with a few exceptions, the random selection of a respondent in a sampled household to complete a supplement survey. The correct weight to use will depend on whether the question your variable of interest relates to was asked of all persons or just of sample adults or sample children selected to answer supplemental questions.
The universe tab for CANCEREV (ever told had cancer) notes that only sample adults were asked questions relating to cancer. This means that non-sample adults will have a not-in-universe (NIU) value for this variable. For additional clarity, IPUMS NHIS provides a weights tab for each variable that specifies which weight should be used. In the case of CANCEREV and other cancer variables, the tab notes that SAMPWEIGHT should be used for all samples except for 1983. If you weight analyses of these variables with PERWT, you are underestimating the effect as PERWT values will be lower than SAMPWEIGHT since a smaller group of selected respondents must be inflated to the same population value.
Note that due to a redesign of the NHIS in 2019, all respondents from 2019-onwards are either sample adults or sample children and should be analyzed with SAMPWEIGHT for person-level estimates. I also recommend referring to this user guide on weights for information on combining and pooling weights over time if this is of interest.
2023-06-27 · General
The IPUMS variable MULTJOB harmonizes data from the original CPS variable PEMJOT rather than PRSJMJ. According to the Census Bureau CPS data dictionary, PRSJMJ (referred to as PRSJMS in the dictionary) appears to be a recode of PEMJOT. However, I wasn’t able to find any documentation on what this recode process entails that is the source of the discrepancy that you’re seeing. PEMJOT rather than PRSJMJ was the variable chosen by the IPUMS CPS team for MULTJOB likely due to this ambiguity as well as the fact that PEMJOT refers directly to a question asked of survey respondents.
2023-06-12 · General
Similar methods for producing annual estimates can be used to calculate five-year averages with monthly CPS data. You will want to create an extract with all basic monthly survey samples (excluding the ASEC) within your five-year period. If you’re looking to use the weights as expansion factors to calculate population-level counts (e.g. the size of the labor force), you should divide your weights by the number of samples that you’re using (i.e. 60 for five years). Note that as with ACS 5-year estimates, 5-year CPS estimates can equate to the midpoint of the time series in certain specific cases, but this is not always the case. Since the population will increase throughout the period, your estimates will be weighted towards the latter half of the period. Note also that the Census Bureau strongly recommends against comparing estimates in overlapping 5-year periods (e.g. 2017-2021 & 2018-2022) since much of the data in each estimate are the same.
2023-06-07 · General
If you’re looking for aggregate state-level place of birth data, my recommendation is to start with IPUMS NHGIS, which provides official census tabular data. This user guide will explain how to access this data and filter tables using the Data Finder tool. When filtering by year (1850) and topic (Nativity and Place of Birth), you should see the table NT12. Place of Birth. This table reports 65 different birthplaces on the state level from the 1850 census. Place of birth however did not appear in decennial censuses prior to 1850, meaning that other sources would need to be consulted to trace the composition of the state’s population prior to 1850.
2023-06-07 · CPS
Whether to adjust this value for inflation is up to the individual researcher since definitions of farming households in the US have changed over time. The $1,000 in farm sales criteria used from 1989-onwards (and as early as the 1974 agricultural census) has not been adjusted for inflation. One option is to follow this example and apply the same threshold to the 1968-1976 sample. However, as this USDA extension piece notes, the fact that this definition has not been altered has affected what is considered a farm due to inflation. If you’re concerned about comparability over time regarding this threshold, you might consider adjusting the threshold for inflation for both your new variable and recoding FARM for the remaining sample. Comparing your results when adjusting for inflation or using a different threshold may also be helpful. You can use this IPUMS note on adjusting for inflation for your calculations.
The $1,000 threshold comes from the method the USDA uses to define farms. I am unsure exactly why the USDA has preferred this definition since 1974 compared with previous ones that included an acreage criteria.
2023-06-02 · USA
Variables are coded N/A when the observation is not in the universe for the provided variable. Often this is due to the respondent not being asked the question that corresponds to the variable. In the case of CHBORN, the universe tab notes that for the 1900 5% and 100% samples, the universe is Females, age 12+. None of the respondents within this universe will have an N/A code of 00 for CHBORN in these samples; only males (of any age) and females under 12 will be coded 00 since they are not in the universe. The universe for CHBORN however is different across years. In the 1910 100% sample, the universe is defined as Ever-married females, age 12+.
I took a look at your extracts and found that you used the select cases feature so that your data file consisted only of women ages 15-49. While all of these observations fit the universe for CHBORN in the 1900 5% and 100% samples, the further restriction on the universe in the 1910 sample that the respondent women must have been married at some point, will result in some women in your sample being outside the universe.
You mention that you tried removing all of these filters, but still do not get the N/A (00) data for CHBORN. I’m not sure if you were successful in this. I noticed that all of your extracts that include the 1900 5% or 100% samples (extracts 24-25, 28-34), all have this restriction in the select cases tool. To check, I created my own extract of the 1900 100% sample without any filters (except selecting cases from Delaware) and had N/A cases in my file. I hope this helps you with your analysis!
2023-06-01 · CPS
Regarding cases with SPLOC >0 and MARST >2, these appear to be cohabiting unmarried couples which IPUMS identifies as spouses in SPLOC. All of the cases that I found coded the spouse with RELATE = 1114 (unmarried spouse). RELATE is created using information from the original census variable RELHD (see UH_RELHD_B4), which reports the respondent’s relationship to the household head. In this instance, the spouse is labeled as being either the head’s unmarried partner with relatives or the head’s unmarried partner without relatives, which causes SPLOC to tag them as the household head’s spouse.
Cases with SPLOC = 0 and MARST <= 2 are explained by the fact that the vast majority of these respondents are coded with MARST = 2 (married, spouse absent). The census bureau page on subject definitions notes that this group includes married people living apart because either the husband or wife was employed and living at a considerable distance from home, was serving away from home in the Armed Forces, had moved to another area, or had a different place of residence for any other reason except separation as defined above. This results in the spouse not appearing in the household roster even though the household head is married. I suspect any other cases where SPLOC = 0 and the respondent reports being married are due to the absence of a logical relationship pairing. A person might report being married, but their RELATE and AGE value don’t yield a likely coresident spouse as per our algorithm.
I hope this is helpful in figuring out whether to use SPLOC or MARST in your analysis.
2023-06-01 · Time Use
For AHTUS samples prior to 2003, secondary child care is recorded across seven different codes in the variable SEC (33 care of infants, 34 general care of older children, 35 medical care of children, 36 play with children, 37 supervise child, help with homework, 38 read to, talk with child, and 39 other child care). The variable ACT_CHCARE notes that care of infants (SEC = 33) includes baby care, usually for infants who are under five. The coding rules further specify that for 1975 & 1985 this includes care of babies aged less than 5 years old. The same cutoff was used in the 1965 and 1998 samples. General care of older children (SEC = 34) in the 1975 & 1985 samples includes care for children of mixed ages (i.e. infants and older children) as well as care for children aged 5-17. In 1965, this included care for children over 5 years. In 1998, it included care for children ages 5 through 17, mixed ages, or ages of children not ascertained.
From 2003-onwards, all AHTUS samples are harmonized versions of the American Time Use Survey (ATUS) data; there is more consistency in these years as the data are fielded as part of the same survey. The ATUS secondary activity codes do not distinguish between childcare for infants and older children or whether the care included medical care, play, or any of the other previous categories. Rather, secondary childcare is segmented into whether it was care of own children and whether it was for household children. The AHTUS reports secondary childcare for own, household children in SEC = 34 (this is available in the ATUS-only database IPUMS ATUS in the variable SCC_OWNHH_LN). I verified that in 2018 all occurrences of SCC_OWNHH_LN in the ATUS are identical to instances of SEC = 34 in the AHTUS. In the 2003-forward samples for AHTUS, SEC includes all secondary childcare of own, household children under the age of 13. The current label for SEC = 34 (General care of older children) is misleading as it is only reflective of pre-2003 AHTUS samples.
I hope this clarifies what’s happening and that care of younger children and infants is included in this code. I will reach out to the IPUMS time use team to request an update to the value label.
2023-05-31 · General
I see that your accounts on IPUMS USA and NHGIS have been approved. That’s a great first step to getting your data. This tutorial, though showing an older version of the website, will guide you through requesting your extract on IPUMS USA (please let me know if you would like additional guidance on accessing IPUMS NHGIS data). When the tutorial notes to select your sample, you’ll need to navigate to the Select Samples page, click on the USA Full Count tab, and hit the check mark next to 1860. When the tutorial notes to add your variables of interest, you will want to add OCC and RACE to your cart. Once you’ve completed these steps and requested your data, this tutorial will guide you through requesting a .csv (Excel) formatted data file. Note that you will need an extraction software to decompress the file once you’ve downloaded it from the IPUMS website. We recommend 7-zip for Windows users and The Unarchiver for mac.
Note that Excel has a limit of 1,048,576 rows per sheet. The 1860 full count file has a bit over 27 million observations (one row per individual). If you wish to view the entire 1860 full count file in Excel, you can use the select cases feature to add STATEICP and other variables to your extract to create multiple files that subdivide the full count into usable segments.
2023-05-31 · General
IPUMS USA and IPUMS CPS both make use of RACE as a variable, however the way race is coded across the two projects differs. IPUMS USA RACE contains two coding structures, one more general and the other more detailed. Adding RACE to your extract will add both the general and detailed codes in the variables RACE and RACED, respectively. Though RACED = 651 appears in the IPUMS USA version of the variable, this is only used in the IPUMS CPS data. I do not see this code in IPUMS USA. As I mentioned, the two data collections are distinct and do not necessarily apply the same coding scheme.
To identify respondents in the 1980 decennial samples on IPUMS USA who are Asian, you will want to add all respondents with RACE = 4 (Chinese), 5 (Japanese), and 6 (Other Asian or Pacific Islander). You can also use RACED to additionally identify respondents who are Filipino (RACED = 600), Indian (610), Korean (620), Native Hawaiian (630), Vietnamese (640), and Other Asian or Pacific Islander (650). You can find this breakdown on the codes tab for RACE by selecting the bubble for detailed codes.
2023-05-26 · General
It does not appear that the race of the slaveholder was collected in the 1860 census. The US Census Slave Schedules provide the names and ownership types of slaveholders, but not their race (only reporting the race of the slave). There is however occupation information (OCC) that identifies respondents engaged in the slave trade in the 1860 census that can be segmented by race (RACE) that you might be interested in on IPUMS USA. You can follow these video tutorials on how to create a personal extract of the 1860 full count file.
Although it’s outside of your timeframe, it appears that the 1790 decennial census does provide slaveholding status by race. You can find this table on IPUMS NHGIS by filtering by year (1790) and topic (slavery). The table NT14. Families by Slaveholding Status by Race aggregates the number of slaveholding families by race by county. I hope this gives you some leads on where to begin your research.
2023-05-26 · General · marked as solution
For your first question about the IPUMS CPS variable PAIDEMP1, it’s not exactly clear why the universe differs from January 2020 through January 2021. Since incorporated self-employed respondents are not in the universe for PAIDEMP1 during this period, it’s impossible to tell whether these respondents employed other people or not; they were simply not asked this question. This universe change is not documented in CPS codebooks, so it does not seem like there is a systematic reason for it. However, I recommend reaching out to census if you would like to learn more.
Regarding the IPUMS USA variable CLASSWKR, this note you quote explains that these samples distinguish between two groups of self-employed persons (which includes employers) - those whose businesses/farms were incorporated and those whose businesses/farms were not. This variable does not reveal whether the self-employed person employed others or not. To my knowledge, there is no variable in the ACS/PRCS that distinguishes those with and without employees.
2023-05-25 · General
I can help with answering questions about IPUMS data and documentation, however these types of analytical questions are outside of the user support team’s purview (and in your case our expertise!). Perhaps someone else on the forum or in your department can help you with figuring out how to best run your analysis.
2023-05-24 · CPS
It appears that RStudio is trying to apply the UseMethod function to the as_survey function, however this is not possible since as_survey is also a function. Would you be able to share where you are getting code to use replicate weights? IPUMS CPS provides this code on the replicate weights user guide. In RStudio, you first want to install the srvyr package:
install.packages(“srvyr”)
library(“srvyr”)
Then, run the as_survey function:
svy ← as_survey(data, weight = ASECWT, repweights = matches(“REPWTP[1-160]+”))
2023-05-22 · NHGIS
You are correct that you can use the integrated industry (IND1950) and occupation (OCC1950) variables on IPUMS USA to crosswalk your NHGIS data to a consistent 1950 coding scheme. These variables leverage year-specific codes in OCC and INC and crosswalk them to a common scheme. For 2000, the dataset 2000 Census: EEO Worksite Data [Large Counties & Places] includes both Census occupation and industry codes that correspond to IND and OCC codes in IPUMS USA. For 1990, the dataset 1990 Census: STF 4b - Sample-Based Detailed Data with Race/Ethnicity Breakdown uses the 1990 census coding scheme.
Your starting point would be to create an extract with IPUMS USA census microdata from 1970-2000 with the variables IND, OCC, IND1950, and OCC1950. This blog post will then guide you through creating a crosswalk between the original IND/OCC code and the integrated variables. Note that you will need to create separate crosswalks for each of your sample years. Once you have your crosswalk, you can apply it to your NHGIS data to code all industry and occupation data to their corresponding IND1950/OCC1950 code.
2023-05-19 · International
I want to provide an update to let you know that the IPUMS International team took a look at the data, and did not identify any systematic omissions or other explanations that would account for the discrepancy you are seeing. One thing to keep in mind though is that the Kenya 2009 IPUMS sample is a systematic sample of every tenth household (rather than person) from the full census. Sampling at the household level may create additional minor discrepancies when looking at population estimates.
2023-05-19 · CPS · marked as solution
Hi Adrian, your interpretation sounds right to me.
Note that RELATE contains two coding structures, one more general and the other more detailed. Adding RELATE to your extract will add both the general and detailed codes in the variables RELATE and RELATED, respectively. You can then use either RELATE = 1 or identically RELATED = 0101 in the detailed codes to the same effect in order to identify the householder, rather than using PERNUM. PERNUM = 1 doesn’t necessarily get you the householder as filtering by PERNUM = 1 will, in addition to heads of households, also include individuals living in group quarters.
2023-05-19 · USA
CLASSWKR contains two coding structures, one more general and the other more detailed. To switch to the detailed coding structure, click the circle next to Detailed codes (see screenshot below). You’ll then see that code 23 refers to Wage/salary at non-profit. Adding CLASSWKR to your extract will add both the general and detailed codes in the variables CLASSWKR and CLASSWKRD, respectively.
2023-05-18 · USA
CONSPUMA and CPUMA0010 identify the most detailed areas that can be consistently delineated in IPUMS USA microdata for this period. As this post details, CONSPUMA bridges 1980, 1990, and 2000 PUMA definitions, so it’s available through the 2011 ACS (the last sample to use 2000 PUMA definitions). CPUMA0010 bridges 2000 and 2010 PUMA definitions, so it’s available for 2000 samples up through the most recent ACS sample.
To extend your series to 2013, it’s necessary to bridge these two periods by creating a crosswalk from CONSPUMA and CPUMA0010. With knowledge of GIS software or with spatial analysis packages in R or other similar tools, you can spatially overlay IPUMS USA’s GIS boundary files for each of these. Note that these shapefiles are based on different versions of TIGER/Line features. As a result, you’ll get many slivers (i.e. invalid intersections among PUMAs where PUMA boundary representations are slightly different). You’ll want to try to identify and ignore such slivers in your final crosswalk.
If you don’t have a spatial analysis package, you can still create a crosswalk by using the PUMA composition files (available through the Geographic Tools page) by identifying common components of PUMAs across time. However, these composition files are limited in detail; some PUMAs could have the same components, but if the boundaries of those components changed at any time, then the PUMA boundaries would change without any change in the composition files.
2023-05-15 · CPS
It sounds like you’re calculating two different measures. The first is the proportion of households, while the latter is the proportion of individuals who own their home. While each measure may be appropriate in the correct context, CPS data are better suited to the former for two reasons. First is that since all individuals within a household will have the same code for OWNERSHP, this variable does not indicate whether the specific respondent owned their own home, but only if the household they resided in did. Calculating a person-level measure would then bias your estimates for younger respondents who live with a family homeowner. Second is that the household head is likely to be the person whose age you want to filter on since they must be a resident in whose name the housing unit is owned or rented. Otherwise, your code for calculating each of these seems correct to me; for household-level measures you should filter observations to the household head and then use ASECWTH for your weight (as opposed to using ASECWT for person-level estimates).
2023-05-15 · CPS · marked as solution
The CPS defines child support (see glossary) as “money received from a parent for the support of their children following a divorce or legal separation.” Child support payments are therefore paid by private individuals. Other variables in the CPS child support supplement such as CSLEGAL and CSAGREE specifically cite an agreement with the child’s father/mother to provide financial assistance as constituting child support.
2023-05-12 · USA
I’m glad you were able to find the data that you were looking for! Just to note, the top of the codes page for BPL has the option to select Detailed Codes , which provides the coding structure for BPLD, the detailed version of BPL (see screenshot).
2023-05-11 · General
I can’t provide any specific feedback on your code, but there are a few things that you should consider in your calculations. First, for household-level analysis, you should limit your sample to one observation per household (usually the respondent with PERNUM = 1). Second, published census estimates will differ slightly from calculations using the ACS since the public use microdata sample available through IPUMS is a subset of the entire ACS sample used in published estimates.
If you could explain how your results differ from your expectations or provide the source for the estimates that you’re comparing your results to, I’ll be able to provide more targeted support.
2023-05-09 · USA
The following Stata code should allow you to create LABFORCE in the 1900 full count file. I tested this on the 1900 5% sample and could match LABFORCE values for all but 0.4% of cases. The unmatched cases are a function of edits that occur further downstream in the IPUMS data processing pipeline and are unrealistic/incredibly cumbersome to replicate outside of our data harmonization and processing software.
gen Labforce = 0
replace Labforce = 1 if occ1950 >970
replace Labforce = 2 if occ1950 <971 | occ1950 == 979
replace Labforce = 1 if relate == 13 & gq == 3
replace Labforce = 1 if relate ==13 & age >15
replace Labforce = 0 if age <16
replace Labforce = 1 if gq == 3 & Labforce == 2
2023-05-09 · General
I’m happy to provide additional feedback, but I’m unfortunately unable to setup a zoom meeting to create a crosswalk. I noticed however your other forum post here and this made me think that you are trying to merge summary data from census with US microdata on the city level; is this correct?
If so, you’ll notice that the IPUMS USA variable CITY has its own coding scheme which is different from place FIPS codes used by Census for cities. However, we include both place FIPS & IPUMS CITY codes in the "PUMA Match Summary" files available in the CITY comparability section. Summary data uses the FIPS codes, so those files enable linkages. Note too that 1980 was the last year in which the city of residence was directly identified for households in US microdata. Since 1990, microdata provides only the public use microdata area (PUMA) in which a given household resided. PUMAs are sometimes coterminous with city boundaries, but they also frequently encompass multiple cities and occasionally straddle city boundaries. Therefore, for most cities, and even for some very large cities, it is impossible to identify the exact set of records in the microdata file that correspond to a given city. CITY infers the city of residence by assigning PUMAs to cities in which the majority of each PUMA’s population resided. A household therefore might not in fact have resided in its identified city. This protocol yields errors of omission (where a CITY code is not assigned to some residents of the corresponding city) and errors of commission (where a CITY code is assigned to some non-residents). To ensure that CITY codes are generally representative of city populations, cities are identified only where the sum of match errors is less than 10% (see the comparability tab for the PUMA CITY match summary).
I hope this information helps you figure out how to best proceed.
2023-05-04 · General
I would be happy to follow-up with more specific instructions to help walk you through the process. Please let me know which datasets you’re trying to merge and the geographic level that you’re trying to merge on. IPUMS also provides a variety of data training exercises on our website. We are currently in the process of creating an exercise that specifically tackles creating crosswalks, which will be available in the fall.
2023-05-04 · USA
For research on aggregate city-level demographics, my recommendation is to access time series data on IPUMS NHGIS rather than microdata on IPUMS USA. Census microdata consistently identifies the city of residence for households only until 1960. In that and all following years, except for 1980, the city of residence is not provided. Instead, other variables need to be used to identify, and sometimes guess, the city of residence for respondent households. In 1990-onwards, the data provides the Public Use Microdata Area (PUMA) that a particular household resided in. Sometimes the PUMA is entirely within the city boundaries, but often it’s only partly within a city. CITY is IPUMS’s attempt to find a solution for researchers by reporting the city in which the majority of each PUMA’s population resided. However, a household might not in fact have resided in its identified city. To determine if your results are missing major cities, you should look at the availability tab for CITY over time.
IPUMS NHGIS avoides these issues by reporting aggregate statistics on counties and places, providing time series tables on race going back to 1970 on the place-level. You can find these by going to the Data Finder tool, selecting Place as your Geographic Level and Race as your Topic. The time series tables are located on the second tab. You can download tables using either nominal data (i.e. using contemporaneous place boundaries) or standardized data (i.e. using place boundaries standardized to a particular year). These can then be supplemented by microdata for prior years when identification of cities is much more practical. Note that while geographic detail is a benefit of aggregated data on NHGIS, there is also a limit to the variables that tables are available for. RACESING is an example of an IPUMS variable for which NHGIS tables are unavailable. That means that when comparing racial identity over time, researchers should keep in mind that respondents in years prior to 2000 were not given the option to identify with more than one race.
Regarding your question on the 1960 sample, the thing to note is that CITY is only available in the 1960 5% sample. This sample can be analyzed separately from the United States, 1850-2021 1% samples by selecting 1960 Census 5% from the Online Data Analysis System page. In the 1970 samples, the smallest geographic identifier available (in the 1970 1% form 1 and form 2 metro samples) is METAREA. Note that due to confidentiality requirements, in 1970 cities were identified in METAREA only if they contained 250,000+ inhabitants.
2023-05-01 · CPS
HHTENURE and OWNERSHP both use data from the same original CPS variable, h_tenure. HHTENURE harmonizes this variable so that codes are consistent over time; OWNERSHP additionally imposes an interview requirement that recodes non-interviewed units to NIU (OWNERSHP = 0) regardless of whether the household tenure category had been determined.
The frequencies displayed on the variables pages for these reflect household-level counts; you can view the universe tab to see which types of households are included in the universe. Note that the IPUMS CPS extract system will default to delivering a person-level extract with household-level measures appended to the person record. Accordingly, frequencies tabulated from an extract will not match the website both because they reflect person-counts and because the default format relies on a person residing in the household and will omit vacant households. To match the frequencies displayed on the website or track vacant units you will need to change the data structure for your extract to “Hierarchical” instead of “Rectangular” (on the person-level).
2023-05-01 · Health Surveys
The universe tabs for CNCERV and CNBRES note that these questions are only asked of sample adults who reported being told that they had any type of cancer (CANCEREV = 2). In the 2015 NHIS, this included 3,289 sample adults. Respondents outside of the universe criteria are coded as NIU. These NIU respondents consist of 70,117 individuals who were not sample adults (including both children and non-sample adults) and 30,350 sample adults who had never been told that they had cancer. The 2019 NHIS redesign removed non-sample adults and children from the survey, which significantly decreased the number of NIU cases for these variables.
2023-04-27 · General
A crosswalk is a table that matches equivalent items across different classification systems. For example, IPUMS provides state codes in both the variables STATEFIP and STATEICP. Each of these use a different system to organize states (e.g. Alabama is coded as 1 in STATEFIP, but is equal to 41 in STATEICP). A crosswalk between these two systems would show you what the different codes for the same state are and allow you to translate values from one system to the other. You can generate a variety of crosswalks on the Geocorr website.
2023-04-27 · USA
This is a great suggestion as well @Chris_B . Thank you for sharing!
2023-04-26 · USA
Hi Tom,
Let me answer your questions in turn:
-
There are many PUMAs that correspond to multiple commuting zones, making it impossible to identify in such cases which commuting zone a particular PUMA/household is located in. You might try to only include PUMAs that are fully within a single commuting zone, though this will obviously affect your estimates for that zone. Alternatively, you might only consider commuting zones that are coterminous with all of its corresponding PUMAs. Official USDA ERS commuting zones stop at 2000 definitions. Chris Fowler with others at Penn State created updated 2010 versions using the ERS methodology here. Both of these files only provide county-to-commuting zone crosswalks. A 1990 vintage PUMA-to-commuting zone crosswalk is available on Geocorr, but you would then need a crosswalk from 1990 to 2000 and 2010 based PUMAs. My recommendation is to use a county-to-commuting zone crosswalk and identify household commuting zones with the IPUMS variable COUNTY. Note that COUNTY can only be identified when the county is coterminous with a single PUMA or when it contains multiple PUMAs, none of which extend into other counties. You will want to look out however for cases when a county is not identified, but the entire PUMA is still within the commuting zone. Note also that 2008-2011 respondents are coded using 2000 based PUMAs, while respondents from 2012 correspond to the Census 2010 based PUMAs.
-
There is no need to modify person weights when aggregating your data and calculating mean earnings. Note again that when identifying commuting zones using COUNTY that some commuting zones will be truncated due to counties not being identified in the data.
2023-04-26 · General
The 1940 census was the first to ask questions about income. You can find more about income and employment questions in the 1940 census in this national archives blog post. IPUMS does provide the variable OCCSCORE (standardized as a z-score in ERSCOR50) in pre-1940 samples, which for respondents with an occupation, reports the median total income of all persons with that particular occupation in 1950. Please refer to this user note for more information about these and other measures of occupational standing.
2023-04-26 · General
The Current Population Survey does not ask any questions about either financial risk preferences or political affiliation. Depending on how you define risk preference, you may be able to draw some inferences on financial risk by observing the distribution of income across various sources, healthcare coverage, or migration status. Regarding political affiliation, the closest comparable variables are found in the voter supplement to the CPS administered biennially in the November basic monthly survey in every congressional election year. The supplement includes several questions on voting behavior including whether the respondent voted, and if they didn’t, the reason they did not vote.
2023-04-26 · IHGIS
I believe your shapefile comes from IPUMS International since IPUMS IHGIS does not provide shapefiles for Philippine administrative boundaries. The shapefiles on IPUMS International do not provide a GISJOIN variable. However, the instructions in the IHGIS user guide explain how you can construct fields to join these geographies. IHGIS data files with “g1” or “g2” in the file name correspond to IPUMS International year-specific boundaries. IHGIS data files with “ga” or “gb” in the file name correspond to IPUMS International harmonized boundaries. Depending on whether you’re using harmonized or year-specific boundaries, the method to join these will differ slightly. You can find more about spatial harmonization on the IPUMS International info page.
2023-04-25 · USA
The 5-year ACS file is a combination of five 1-year ACS files where the weights have been divided by 5 (see the PUMS 5-Year Accuracy of the Data report). If you’re looking to generate estimates for only a single year using the 5-year file, you will need to undo this process by multiplying the weights by 5. Alternatively, you can simply use the 2021 1-year ACS file.
2023-04-25 · USA
It is not improbable for the weighted number of households to be slightly greater than the number of persons. Part of this discrepancy is due to rounding of person-level weights. Another part is the fact that person-level weights, unlike household weights, are stratified to match totals by demographic characteristics on the county level. You can find more about ACS sampling and weighting in the ACS Design and Methodology Report.
2023-04-25 · CPS
You can use CPSIDP as your panel variable as it does not contain repeated values within a single time period. Individuals appear only once within a given monthly sample and eight times total across the 16-month panel.
2023-04-24 · USA
While IPUMS does not publish a separate crosswalk from IND1950 to IND1990, you can obtain a crosswalk by adding both variables to your extract and observing which IND1950 industries match to which IND1990 industries. By assigning any individual to a sector based on IND1990, you will immediately know the IND1950 code because both are assigned to the same individual.
2023-04-19 · International
The variables you mention appear to have been created by the researchers with the IPUMS attach characteristics tool. This tool creates a new variable that reports a selected characteristic of one of the respondent’s available relations. You can find the tool on the extract request page after viewing your data cart (see this video tutorial).
It appears the researchers added the person number (PERNUM), nativity (NATIVITY), country of birth (BPLCNTRY), and the state of birth (BPLUS) of the respondent’s household head (HEAD), mother (MOM), and father (POP). These are based on the links found in the variables MOMLOC and POPLOC. These probable family links were imputed by IPUMS using available data as described in this guide. You can find further information on the type of link imputed in MOMRULEH and POPRULEH. Note that you can alternatively derive mother’s and father’s birth country and state in the original source variables MBPL/FBPL and MBPLUS/FBPLUS.
2023-04-19 · CPS
There aren’t any variables in the CPS that directly capture kinship care. While RELATE describes the relationship between the line respondent and the household reference person (household head), this does not directly capture kinship care since neither of the minor’s parents will necessarily be the household head. The child may even be unrelated to the household head if they are part of a second family living at the address. There are however some variables you might still use to get an estimate of kinship care.
IPUMS constructed variables MOMLOC and POPLOC will likely be helpful as they report the individual’s probable mother and father line number within the household, respectively. Note that these group social relationships such as step- and foster-parents together with biological parents in one group labeled “parent”. These interrelationship variables will be reported for the respondent regardless of their age as long as the probable parent is present in the household (otherwise the value defaults to 0). If you’re looking at children who are being taken of by a family member in place of their parent(s), you might restrict your sample to households with minors who report both 0 for MOMLOC and POPLOC. In cases where RELATE indicates a family relationship to the Householder, then MOMLOC=0 and POPLOC=0 indicate a likely kinship care arrangement. If MOMLOC=0 and POPLOC=0 and the child is not related to the householder, then there are two cases:
- If there are other non-relatives in the household, they might be the caretakers of the child, but we don’t actually know if they are even related to the child, so individual researchers will need to make a judgement call there.
- No other non-relatives, then it seems to be a non-kinship care arrangement.
Once you’ve determined which households you believe engage in kinship care, you can use HHWT to estimate the number of these households for each state.
2023-04-14 · USA
Hi Sally,
I’m not exactly sure which counties you’re using for your city boundaries with PWCOUNTY, but I tried replicating your finding using Franklin County, Ohio and Dallas County, Texas and did not find the significant decrease that you mention. Specifically, I’m finding 34,930 self-employed not incorporated workers in Franklin in 2019 and 33,175 in 2021. For Dallas, this value is 91,510 for 2019 and 93,120 for 2021. You can see my results in Stata for Dallas below. The 5-year ACS file provides an estimate of an average value over the 5-year period rather than estimates for each individual year. Therefore, I first multiply the weights (i.e. PERWT) by 5.
Note that neither of these counties are perfect boundaries for their respective city. You might therefore generate estimates for their respective metropolitan area using the IPUMS variable MET2013, given that the sum of errors for both of these areas are relatively small. While the microdata does not allow for identification of many major cities that are intersected by PUMAs, official census tables are available for such aggregated data both through IPUMS NHGIS and the Census website (e.g. Columbus 2021). Note that the census table estimates include unpaid family workers and only respondents who are currently employed (the universe for CLASSWKR is Persons age 16+ who had worked within the past 5 years ). I hope this helps you figure out what’s happening with your data.
2023-04-04 · USA
You’re likely to get a much better match using your method of concatenating STATEFIP and COUNTYICP for the 1940 full count than in 1860 due to how IPUMS NHGIS treats codes for territories that had not yet entered the union. For example, in samples when Minnesota was a territory, NHGIS uses the FIPS code 275. This would have affected your ability to match codes in 1860.
COUNTYNHG codes are 7-character county identifiers. The first 3 characters give the NHGIS state code and the last 4 characters give the NHGIS county code (both being FIPS + “0”). Moreover, since ICP county codes are also almost always (except for the case of Maryland) given in the format FIPS code + “0”, the combination of STATEFIP, “0”, and COUNTYICP, both of which are available in the 1940 full-count, should give you the correct COUNTYNHG code.
There are a couple things to be aware of however. First, since FIPS codes were instituted around the time of the 1970 census, historical counties that were dissolved before then have no FIPS code. For such counties, ICPSR generally appends a fourth digit of 5 rather than a 0. Second is that these codes should include leading zeros. For example, the NHGIS state code for Connecticut is 090 (FIPS code “09” + “0”) and the ICP county code for Fairfield county is 0010 (FIPS code “001” + “0”). The COUNTYNHG code for Fairfield county, CT therefore is 0900010.
Alternatively, IPUMS NHGIS 1940 shapefiles include the variables ICPSRST (state ICPSR codes) and ICSPRCTY (county ICPSR codes). You can build the crosswalk using these variables together with STATEFIP and COUNTYICP from IPUMS USA. Both of these methods are likely to yield only a few mismatches.
2023-03-30 · USA
raceeth is a variable created by another user in the online analysis tool that uses responses from RACE and HISPAN; it codes respondents of any race who reported being Hispanic into a Latino category. For example, someone who identified as Black and Hispanic will be coded as Latino and will not be included in the non-Hispanic Black category. Using this variable in combination with POVERTY and STATEFIP in the online analysis tool (see screenshot below), I’m finding that non-hispanic Blacks form 9.4% of the proportion of individuals under 125% of poverty in Iowa. This corresponds to 43,548 individuals from a total of 114,523, or around 38% of the total non-hispanic Black population of Iowa. This is within the margin of error of the official Census ACS data table which reports that 38.4% (with a 2.3% margin of error) of the state population that identifies as only Black or African American earns less than 125% of the poverty line. I recommend reviewing the variable description for POVERTY to note how it is constructed to determine if it’s comparable to the data your organization collected.
2023-03-27 · USA
0s in INCWAGE indicate that the respondent did not earn any wage or salary income. This information is asked for all persons above a certain age (specified in the universe statement) regardless of whether they were employed or not. Anyone below this cutoff and outside the universe will be given the not-in-universe (NIU) code 999999. Any missing data is coded with 999998.
2023-03-24 · General
If you’re looking to spatially join summary data with microdata on IPUMS USA, you will need to match the correct geography codes across your two datasets. American Community Survey data from IPUMS USA provides geographic identifiers for state, county, PUMA, and metro area. Note that not all counties and metro areas are identified in the microdata; please refer to the description and codes tabs for these variables to determine which areas you will be able to join. You may need to create a crosswalk that will match the corresponding codes across your datasets using the name of a location. The list of IPUMS USA identified counties may be a good starting point as it provides the codes that IPUMS uses to identify both states and counties. When joining county or PUMA, you will need to include the state FIPS/ICP code in the variables you merge on since both county and PUMA codes in IPUMS USA are state-dependent. It’s important to also note to keep leading zeros when they appear in geographic identifiers.
I hope these notes are helpful; please feel free to follow up with more details on the data that you’re looking to join and I can provide more specific feedback.
2023-03-24 · CPS · marked as solution
The census website will often present summary tables using bracketed income, such as these current population survey data tables, since they are easy to interpret. However, continuous household income is available in the CPS ASEC microdata. You can find the original CPS ASEC codebooks that list all variables available in the public use microdata sample (PUMS). In this case, the 2022 codebook notes that HHINC is bracketed and that HHINC is a recode of the continuous variable HTOTVAL. IPUMS uses HTOTVAL to create HHINCOME. IPUMS CPS will almost never edit original census data and if any such edits are made they will be mentioned in either the variable’s codes, description, or comparability tab.
2023-03-24 · NHGIS
The 2020 IPUMS NHIS sample was released on October 27, 2021; the 2021 sample was released on October 13, 2022 according to the revision history. Both of these samples are currently available on the sample selection page.
2023-03-23 · USA
While my previous statement about the sources represented some of the places that this information is derived from, I should have stated that we coordinate directly with the Census Bureau to get the relevant information for the Editing Procedures tab. If you email ipums@umn.edu with more information about your interest in the underlying information, we can coordinate directly about the questions you have and if there is an efficient way for us to provide you with more documentation.
2023-03-23 · USA
Hi Tom,
Your method of dividing the sum of INCWAGE by the sum of PERWT by state treats each value of INCWAGE as having equal weight. In order to calculate a weighted mean, you will need to find the product of INCWAGE and PERWT for each observation, sum this product for all observations within a given state, and then divide this sum by the sum of PERWT for the state. Please note that values of 999999 refer to respondents who are not in the universe for INCWAGE and 999998 refers to missing values. Replicate weights should be used to calculate standard errors, but they will not affect your point estimates.
IPUMS USA also offers an online analysis system that can calculate means without requiring users to download data themselves. I’m attaching a screenshot of the type of analysis you might run and the corresponding output screen.
2023-03-17 · USA
Information about the editing procedure for the ACS is derived from a variety of Census Bureau documentation including the Code Lists, Definitions, and Accuracy page, the Design and Methodology Report, and Census Blogs. If you have a question about a particular variable, please let me know and I will be able to provide a more targeted answer.
2023-03-14 · USA
I’m not aware of any crosswalks that map IND1950 into these three sectors. The US Census Bureau currently uses the 2017 North American Industry Classification System (NAICS) to classify industries into one of 20 sectors, 10 supersectors, and two super sector groups (the goods-producing industries and service-providing industries); you can find older classification systems used by Census on this crosswalks page. You may be able to create your own crosswalk between IND1950 and the NAICS groupings (available in the variable INDNAICS). However, since the NAICS is regularly updated, you would need to decide on a vintage of the NACIS to use to compare how IND1950 maps into these categories (see this blogpost on how to construct your own industry crosswalk). As an alternative, coding for IND1950 does provide a consistent grouping of industries into 16 sectors, including agriculture, forestry, and fishing, manufacturing of durable goods, manufacturing of nondurable goods, and several different service sectors. You might use these to construct your own grouping of industries into your sectors of interest.
2023-03-10 · International
Hi Ani,
Your estimates of the total population are accurate given the data provided. Since the IPUMS sample of the 2009 Kenya Census is a random 10% subsample of the official data (you can find the details on the sample characteristics page), some estimates are expected to be slightly off from official statistics. The discrepancy does however appear to be greater than the margin of error for this data would suggest. I am reaching out to the IPUMS International team to see if there is any more information I can provide on how this 10% subsample was selected and will follow up here as soon as I hear back.
2023-03-09 · USA
The SOC to ACS Crosswalk on this BLS page maps more specific SOC codes into general ACS codes without using the XX and YY notation. Note that this will not allow you to map from ACS to SOC codes since a single ACS code may map to multiple SOC codes (to do this, you would need a crosswalk with employment data on the SOC level). I hope this helps you work around the issue of incomplete codes.
2023-03-09 · USA
You will need to check the box to attach characteristics for each of the variables that you’re interested in for the mother and father. Doing so will create a new variable for each checked box that reports the respondent’s family member’s response to the particular question. Note that the attach characteristics tool uses IPUMS created variables MOMLOC and POPLOC to determine each individual’s parents. You may be interested in reviewing the documentation on family interrelationship variables to better understand how these links are constructed (e.g. including social relationships such as step and adoptive parents). This video tutorial, though showing an older version of the website, should nevertheless help guide you through using the tool.
2023-03-07 · USA
It sounds like you’re trying to find the sample of households that are in the bottom 20th percentile of household income and then calculate the average income of that group. If so, I recommend that your first step be to restrict your sample to cases where PERNUM is equal to 1 to focus your analysis on households. To get the cutoff for the 20th percentile, you should first sort by household income and then create a new variable that will represent the cumulative sum of weights (CUWT). You will want this variable to equal the sum of HHWT for the corresponding household plus CUWT for the previous observation. Then, divide CUWT by the total sum of HHWT in order to calculate your sample’s percentiles. The income cutoff for the 20% percentile will be the observation where this variable is equal to 0.2. In Stata, you can use the handy function pctile (e.g. pctile IncomeQuintile = hhincome [pw=hhwt], n(5)) which will divide your data into as many quantiles as you need.
To get the average income for this subsample, you can sum the product of HHINCOME and HHWT and then divide this value by the sum of HHWT for these households. In Stata, this would include setting the data with svyset [pw=hhwt] and then running svy: mean hhincome if hhincome < [insert 20th percentile cutoff]. Please also note that HHINCOME values of 9999999 refer to respondents living in group quarters rather than earnings of $10 million.
2023-03-07 · USA
Hi Lorenz,
This is explained in the PUMS Accuracy of the Data report which discusses the weighting procedure for the 5-year file. The report states that the “5-year PUMS initial weight is equal to the product of the ACS 1-year final weight for the record and the PUMS subsampling factor divided by five.” You can refer to the report for more details on weighting in the ACS
2023-03-03 · USA
Crosswalks between OCC and OCCSOC are available on this new page.
You can download the 2012 ACS occupation code list from the Census Bureau, which includes the note shared by Joe, from the 2012 ACS PUMS documentation page.
2023-03-03 · USA
METPOP10 does not rely on a household’s metropolitan area of residence in MET2013, but rather uses its own model and criteria for its estimates. Firstly, as the description tab notes, METPOP10 will report a metro area’s population for households residing in a PUMA only in cases where the PUMA is fully within a single metro area. This is more strict than identification in MET2013, which requires that only a majority of PUMA households reside within a metro area. In cases of overlap between a PUMA and a metro area, including whether or not MET2013 is identified, METPOP10 instead reports an approximation of the size of the commuting system PUMA households reside in. Specifically, it uses the populations of all overlaps to arrive at a population-weighted geometric mean of the size of the commuting system. For respondents living in PUMAs with no metro area overlap, METPOP10 uses a similar method with county populations instead.
The METPOP10 description links to a working paper with example figures showing how PUMAs match up with the populations used to compute METPOP10. There’s now also an open version of the published article via PubMed Central.
Regarding your second question, IPUMS has not computed average metro/micro populations for MIGPUMAs. If you’re interested in doing this yourself, we recommend using the working paper as a guide together with the migration PUMA composition files (for relationships to PUMAs) and GeoCorr (for relationships from PUMAs to counties and 2013 CBSAs).
2023-02-28 · General
If you are using ACS or decennial census microdata from IPUMS USA, you can add the variable IND to your extract (for analyses with IPUMS CPS data the analogous variable is also called IND). Both of these report the primary industry a respondent currently or recently worked in. You will need to consult the Codes tab to determine which industry codes correspond to based on the sample year(s) that you are analyzing. Note that industry codes are regularly updated, meaning that a code in one sample year will not necessarily match a code in a different year. IPUMS harmonized industry variables (e.g. IND1990) which recode industries across year-specific classification schemes are available to facilitate cross-time comparison. Once you’ve created your extract and downloaded the data, the industry codes will allow you to filter your analysis to particular industries.
2023-02-28 · USA
This forum post with a similar question provides a CIP-Census crosswalk for the field of degree codes. I’m attaching the same file to my response here.
crosswalk_handout.xlsx (144.8 KB)
2023-02-28 · Time Use
I wanted to follow up on a few more points to help better clarify the issue.
The first is that ATUS replicate weights are derived from CPS replicate weights. The process of using replicate weights is described in the BLS ATUS user guide and is identical to the one on the linked CPS page. Secondly, STRATA and CLUSTER are not MPC or IPUMS products, but are original variables released by the BLS in the ATUS as GEPSEUST and GEPSEUCL. The BLS stopped providing these variables in 2014. The last point is that while you can stratify your analysis by year, the Census recommended approach is specifically to use replicate weights for variance estimation.
I hope this is helpful!
2023-02-28 · USA
A possible solution to this issue is to create a new text file called “.Renviron” in your home directory. You can find your home directory with R using Sys.getenv(“HOME”). Then, add the line R_LIBS_USER = “C:/Users/15774” to the file and save. Try to restart RStudio and add the package again. This should solve the issue. Please follow up if this solution doesn’t work for you.
2023-02-27 · USA · marked as solution
Hi Ben,
Your estimate using IPUMS ACS data is including people living in group quarters, which are not considered households by Census. When restricting your data to respondents with GQ values of 1,2, and 5, IPUMS ACS data should give you an estimate of 120,756,015 for the total number of households in 2019. Though the numbers still don’t perfectly match, this discrepancy is due to official statistics being calculated from restricted-access data that is not available through IPUMS.
2023-02-25 · NHGIS
Hi Adriana,
While IPUMS NHGIS does not have separate population density data, you can calculate the density yourself using the available data. You will need to obtain a table with total population and land area on the census tract level and use it together with the census tract shapefile. You can find this data in source tables using the IPUMS NHGIS data finder tool by filtering by geographic level, years, and datasets. Documentation on the various tables and what they contain is available. Land area is given in all source tables drawn from decennial census datasets 1980-2020 (in the variable AREALAND recorded in square meters), while total population is provided in source tables where the universe is the total population.
You can also grab the census tract shapefiles off of the GIS Files tab. Your source tables can then be joined with the GIS file using the GISJOIN variable (this tutorial outlines how to do so).
2023-02-24 · USA
There are many different data visualizations that can be accomplished using R. You may be interested in these visualization in R resources from GeeksforGeeks and R for Data Science to get started. One of the simplest visualizations you could do is to plot the variable by creating a new variable
(e.g. NewVar<- data$[insert variable name]) and running the function plot() with this new variable (i.e. plot(NewVar)).
I also forgot to mention that we recommend researchers use replicate weights (REPWTP) to produce empirically robust standard errors. I am linking to guidance on implementing replicate weights in R from IPUMS USA.
2023-02-23 · Time Use
I’m glad to hear that you found the exercises helpful! The technique you mention above is the correct way to incorporate multiple module weights. When using data from ATUS modules, researchers should pair that module’s weight with respondents to that module. When including respondents from multiple modules, researchers can use multiple module weights, pairing respondents to their respective module weights. The easiest way to do this is to create a new weight variable that takes on the value of the appropriate weight for each respondent. The same rules should be applied for module replicate weights, including RWBWT for person-level analysis and RAWBWT for activity-level analysis of the well-being module.
2023-02-23 · CPS
Hi Katherine,
You can follow the instructions on the Introduction to ipumsr page. You’ll need to install the ipumsr package and download the DDI codebook provided with your extract to a working directory. Set your working directory with setwd() as the folder with both your datafile and the codebook. Your last step will be to grab the R code in the command files tab of your extract and run it to input the data into R. Please follow up if you are still experiencing any difficulty with the data.
2023-02-22 · USA
Replicate weights are only available beginning with the 2005 ACS sample, so this code will not run on any 2000 sample. I ran your code on a subsample of the 2021 ACS and was able to generate estimates using replicate weights without encountering the error you mention. The only change that I made was excluding your year==2000 criteria. Please see the screenshot below. I hope this is helpful in figuring out the cause of the error.
2023-02-16 · NHGIS
Excel typically only allows for a bit over 1 million rows, which is significantly less than the number of observations contained in the MLP linked datasets. This is likely the cause of the error. These datasets are instead intended to be used in Stata to link observations across two or more full count files. This user guide explains how to implement the linking procedure and includes sample Stata code at the bottom of the page. The IPUMS USA team is working on adding an option to download longitudinal files directly from the extract system in the future, but I don’t have a timetable for when this will be implemented.
As for converting pre-1950 individual population microdata, the variable ENUMDIST (enumeration district) is the smallest geographic identifier available in all of the 100% samples starting from 1880. You should be able to find maps for Omaha’s Census enumeration districts from other sources online such as SteveMorse.org, US-Census.org, and FamilySearch.org.
2023-02-15 · USA
This forum post should have the answer to your question. Please let me know if you would like further clarification on any of the inputs into the survey package.
2023-02-15 · USA
I don’t have an answer for the question of what is a typical R^2 for regressions using ACS data and it seems unlikely to me that you will be able to find an answer to such a broad question. Some relationships may involve only a few well observed variables and thus will generate higher R^2 values when the correct variables are specified in a regression model. Other relationships are much more complex and involve unobserved variables that cannot be included in the model, causing a decrease in the R^2. The expected R^2 will depend on the relationships you’re evaluating in your paper and what previous research has found on the specific issue you’re studying.
2023-02-15 · USA
I haven’t seen this error before. I’d be happy to take a look and provide some guidance on using replicate weights. To troubleshoot, it would be helpful to see your svyset code and the estimation command you are running as well as any information you can share about your analytical sample.
2023-02-10 · General
The ACS is a questionnaire which gathers information on every person within a sampled housing unit (i.e. household). The variable NUMPREC will tell you the number of person records associated with the household. You could then divide that number by ROOMS or BEDROOMS to calculate your measure. Note that a household may include multiple unrelated families, but it only includes those individuals for whom the unit is their usual residence (you can review the residence rules here). However, you will not be able to obtain this data on the neighborhood-level as the lowest geographic detail reported in the Public Use Microdata Sample is on the Public Use Microdata Area (PUMA). Luckily, this data is also available in geographically aggregated tables through IPUMS NHGIS that are not bound by the same geography disclosure rules as the ACS. Using the Data Finder tool, you can select Occupants per Room as your topic as well as the time period and geographical level of your choice. The table Tenure by Occupants per Room provides a breakdown of occupancy rates into five intervals for renter, owner, and general occupied housing.
2023-02-10 · USA
Hi Ting,
I’m not sure if your question is about finding the size of the sample of interviewed individuals or about estimating the size of a certain population in the US. The ACS is a 1% sample of the US population with around 3.3 million respondents in 2021. However, it can be used in conjunction with PERWT to estimate population level statistics, such as the number of employed individuals by state, for the entire US population. To find the number of individuals in the sample who are employed, all that you need to run is tab statefip year if empstat==1. However, if you want to produce an estimate of the number of employed people for the entire US population, the process requires you to first set your data as survey data with svyset [pw=perwt] and then run svy: tab statefip year if empstat==1, count format(%12.1gc).
Your second command will not produce an estimate of the unemployment rate. The general equation is employment_rate = unemployed/(employed + unemployed); you would need to modify the command I included above to generate the number of employed persons and then input your estimates into the equation for unemployment to calculate the rate. Note that the Census Bureau recommends the usage of replicate weights (REPWTP) in the calculation of standard errors. This page on CPS replicate weights provides information on how to use these weights in Stata.
2023-02-10 · Time Use
Hi Thomas,
The ATUS user guide recommends calculating standard errors with replicate weights (RWT06). The Census Bureau produced these replicate weights by using what is known as the Successive Difference Replication (SDR) method, which involves repeated implementations of the initial weighting algorithm. RWT06 is available across all samples aside from 2020, when RWT20 is available instead. This page on CPS replicate weights provides information on how to use these weights in Stata.
If you were to go the route of calculating standard errors using STRATA and CLUSTER, you should note that these are not available across all sample years. Also, while I believe the clusters and strata should be renumerated to be year-specific due to annual resampling, I am not aware of any formal guidance from BLS for how to handle these in pooled extracts.
2023-01-26 · General
Based on your screenshot, you have requested a data file that is rectangularized on activity; each line in the data file will be an activity reported by a respondent. You can use the CASEID variable to identify respondents. In your screenshot, the respondent with CASEID 20100101100019 recorded 12 activities during the day that they were interviewed about. For the first 12 lines on your data, the respondent’s industry and occupation will remain the same because this is all data on the same individual. Information collection on a new respondent begins when the CASEID number changes on line 13.
Well-being variables such as SCHAPPY, SCSTRESS, and MEANING report the respondent’s feelings while performing a specific activity and do not describe their overall well-being. Moreover, these variables only report well-being for three randomly selected activities. To what extent they affect the respondent’s overall well-being is unclear. One avenue you might consider is to compare reported well-being for activities across industries and occupations. For example, you can compare the value of SCHAPPY when it is reported for activities that involve reading across industries and occupations. Please be aware however that estimates using small sample sizes will have larger margins of error. For additional guidance, I recommend taking a look at the FAQ page, this video tutorial on how to create an extract, as well as available training materials, and previous workshop presentations.
2023-01-23 · CPS · marked as solution
Hi Chantal,
Perturbed data will introduce some measurement error into your results, attenuating the effects of any relationships towards zero. An example of how purposefully introduced measurement error in Census data affected outcomes is provided in Cleveland et al. (2012). For privacy reasons this is simply a current reality when working with public use microdata. I hope that information helps!
2023-01-23 · CPS
Both WNLOOK and WHYABSNT provide only a single main reason for why a respondent is not looking for work or absent from work. In the case of WNLOOK (DWRSN in the original documentation), enumerators are given 10 mutually exclusive options, as well as an other option that they can use to categorize a single response. They are specifically instructed in the labor force section of the interviewer’s manual not to read the list of options, but to simply categorize the answer to the open-ended question, “what is the main reason [they were] not looking for work during the last 4 weeks”. Therefore, childcare responses are tabulated by coding every participant who stated that childcare is the main reason. This question is asked of all persons 15+ who are not working, have not looked for work within the past 4 weeks, but do want a job. In the case of WHYABSNT (ABSRSN in the original documentation), enumerators are given 13 options, as well as an other option to categorize a single response. There are no specific instructions regarding reading the list of options for WHYABSNT, but enumerators are advised to provide neutral probing questions when an answer is unclear. One might interpret this as an indication that enumerators generally do not read the list.
KIDDUTY and related variables such as BLVENOWK were asked of outgoing rotation groups (ORGs) in the ASEC between 1976-1994. They were not mutually exclusive as enumerators recorded all possible responses. In 1994 these were replaced by WNLOOK, which only asks for the main reason the respondent did not look for work
2023-01-23 · Time Use
We’ve already corresponded about this by email, but I wanted to post a follow-up here for reference for other IPUMS users. We really appreciate you bringing this issue to our attention as it helps improve data on IPUMS for all users. After reviewing the data and discovering the source of this inconsistency, IPUMS Time Use derived corrected weights for RECWGHT, INFLTWT, and XTIMEWT in the 2018 American Time Use Survey in the AHTUS. These were released on 1/18/23. We recommend anyone who used the previous weights to re-run their analysis with the corrected weights. Please reach out to us through this post or at ipums@umn.edu with any further questions on this issue.
2023-01-20 · CPS · marked as solution
Cross-sectional analyses using any outgoing rotation group (ORG) variables should use EARNWT even when other non-ORG variables are included. Researchers should use the weights that correspond to the strictest sampling universe in their analysis. Since ORG variables are drawn from a universe of respondents in month-in-sample 4 and 8, they are more restrictive than the universe of all basic monthly respondents or that of any monthly supplement. Since DURUNEMP is available in all basic monthly surveys, you can run this analysis without needing to link respondents across their time in the panel. If you are not using the data cross-sectionally and are leveraging the panel aspect of the CPS, you will instead need to use longitudinal weights since this represents a further restriction on your sampling universe.
2023-01-20 · USA
I was glad that you found other studies to help guide your analysis! Please feel free to add them again as they may be a helpful reference for others.
I do want to briefly explain how MET2013 works since this is relevant to your model. Specifically, household location in the ACS PUMS is reported on the Public Use Microdata Area (PUMA) level. These are areas that have between 100-200k people and can subdivide or include multiple counties (you can find a map of these here). IPUMS uses PUMAs to impute residence in metropolitan areas. The protocol used by MET2013 is to assign a metro area to all residents of a PUMA if a majority of the PUMA’s 2010 population resided in the MSA. However, since PUMAs can cross MSA boundaries, assignment to a particular MSA does not imply that the selected household must have resided within that MSA. This code assignment protocol yields errors of omission (residents of an MSA who are not identified as residents) and errors of commission (non-residents who are identified as residents). As an index of mismatch, IPUMS uses the sum of percent omission error and percent commission error. MET2013 reports no code for MSAs where the sum of match errors is 15% or more. You can find the match summary on the description tab for MET2013 to determine the level of mismatch that you’re willing to tolerate in your analysis.
2023-01-20 · CPS · marked as solution
Your first question regarding the changing universe for industry and occupation codes is unfortunately an issue with the original data. The comparability tab for OCC notes that “only one-fourth of CPS respondents who were not currently in the labor force were asked about their past occupation.” This appears to be the same for industry as well as occupation codes and explains cases where a respondent has a missing industry value during a period they are not in the labor force, even though they were employed in the previous month. Additionally, the comparability tab also references cases where “respondents are shown as having valid responses despite not meeting universe requirements.” Unfortunately, there are some inconsistencies with the universe for these variables that we do not yet understand. While you might attempt to impute industry and occupation codes, we leave the choice to researchers on how to best proceed.
The attached spreadsheet explains how to isolate marginally attached workers. Specifically, the variable UH_DSCWK_B2 identifies both discouraged and conditionally interested workers, both of which are included in the set of marginally attached workers.
U-1 through U-6 definitions for IPUMS CPS.xlsx (10.1 KB)
2023-01-18 · General
It appears that each line in your data extract is a singular activity reported by a sample respondent. For example, the respondent with CASEID 20100101100019 recorded 12 activities during the day that they were interviewed about. This format allows you to analyze each activity individually. For example, it shows that they reported being happier (SCHAPPY) while doing the third activity as compared to when they were engaged in the fifth activity. This FAQ page contains more information about the difference between rectangular and hierarchical data.
You can change the data format on the extract request page (screenshot below). Click Change next to Structure and select between rectangular person level data without activity information, rectangular activity level data (which you currently have), or hierarchical data which includes both person and activity level data as separate entries.
2023-01-13 · Time Use
You are correct that it’s necessary to adjust incomes to a given base year. You can find the adjustment factors on this page. Adjusting categorical income however is tricky and is up to the researcher’s discretion. One method is to assign a single value to the interval, such as the midpoint, and adjust all observations within this range for inflation using that value. I also recommend taking a look at what methods others have employed in the literature; a google search provides a different suggestion here.
Alternatively, you may be able to derive the exact family income by linking respondents to their final CPS interview where they responded to a set of outgoing rotation group questions including EARNWEEK and WKSWORKORG. I’m happy to provide more information on how to go about linking respondents and reconstructing family income if that’s something you’re interested in.
2023-01-13 · CPS
This is definitely a question that can be answered with the CPS, but it will require some manipulation of the data. Specifically, it will require leveraging the panel component of the CPS to observe individuals over time. I will provide a bit of information on the panel aspect of CPS, how to think about transitions out of retirement, variables to use to get timing and geographic information, and some comments about making population estimates.
Individuals may be included in the CPS up to 8 times over a 16-month period. IPUMS CPS provides pre-linked data files linking individuals who participate in the annual socioeconomic supplement (ASEC) between their first and second ASEC interview (this file will capture the person at two time points); however you can manually link individuals across months using CPSIDP (this approach will yield up to 8 observations). Once you have linked individuals, you will look for instances where the person’s EMPSTAT value changes from “NILF, retired” (EMPSTAT = 36).
If you’re only interested in transitions from retirement to having a job, you will want to note cases where EMPSTAT changes to “At work” (EMPSTAT = 10) or “Has job, not at work last week” (EMPSTAT = 12). If you’re interested in transitions from retirement into the labor force regardless of employment status, you will also want to include cases where EMPSTAT changes to “Unemployed, experienced worker” (EMPSTAT = 21) or “Unemployed, new worker” (EMPSTAT = 22). You can use the MONTH and YEAR variables to identify when this transition occurred. You can then use a geographic identifier such as STATEFIP to estimate the total number of these transitions for a given place.
Since people transitioning out of retirement in a specific time period or in a specific location is likely to be a small population depending on how granular your place and time specifications are, I recommend keeping a close eye on the margin of error for your estimates. Note that using CPS data longitudinally requires different weights to get correct population estimates. If you are linking respondents across the full 8-month panel, you will want to use the longitudinal weight LNKFW8WT. You can find other longitudinal weights here for alternative research designs such as linking respondents across adjacent months or between two years.
2023-01-13 · USA
The codes for OCC are specific to each sample year and are available on the codes tab for OCC. You might consult the appropriate Standard Occupational Classification (SOC) manual used to develop the OCC classification scheme for more details about each occupation group. Note that in Multi-Year ACS files, OCC codes are based on the final year included in the sample. Unfortunately, material offering detailed descriptions of occupational tasks before 2000 is scant.
For harmonized occupation measures (i.e. OCC1950 and OCC1990), IPUMS simply iterates occupation code assignments from the Census Bureau through a series of crosswalks to associate them with the most probable occupation in a different coding scheme. This process is described in further detail, with links to cited working papers, in chapter 4 of the IPUMS USA user guide. For more detail on the occupations in the harmonized occupation variables, researchers should consult the contemporaneous occupation coding scheme (e.g., OCC codes for 1990 for OCC1990). You might also try creating a crosswalk between OCC for your sample year of interest, OCC1950, and OCC1990 to observe how harmonized occupations map to their year specific counterpart(s). For example, farm managers (OCC1990 = 475) may map to multiple OCC codes in the 1940 census, giving more insight into who is included in this category in 1990. If you can map these occupations to a sample year after 2000, you will also be able to use the SOC manual to look at the description for each mapped occupation.
2022 · 131 replies
2022-12-15 · CPS
The validation code we provide as part of the workshop requires that a respondent appears in all timepoints being linked. To use the code, you will need to specify the number of expected observations based on the linkage type you’re working with. For full-panel links, this number is 8. For adjacent-year links or adjacent-month links, this number is 2. This code assumes presence in the survey at all linked time points. If you’re interested in respondents that did not complete the panel and want to validate records with partial panel completion based on demographic variables, you will need to write your own validation code. With long formatted data, you might try something like this:
egen sex_min = min(sex), by(cpsidp)
egen sex_max = max(sex), by(cpsidp)
gen match = 0
replace match = 1 if sex_min = sex_max
Repeat the same for RACE. With AGE you will want to give a 1-year buffer for those under 84 and a 5-year buffer for those 84 and above. You can then generate an all_match variable that is equal to 1 if all of the variables match.
2022-12-15 · CPS
IPUMS CPS samples starting from 2020 use the 2018 Census occupation classification scheme developed using the Standard Occupational Classification (SOC) Manual: 2018 to categorize OCC codes. The manual provides the following descriptions of these occupations:
39-9011 Childcare Workers
Attend to children at schools, businesses, private households, and childcare institutions. Perform a variety of tasks, such as dressing, feeding, bathing, and overseeing play. Excludes “Preschool Teachers, Except Special Education” (25-2011) and “Teaching Assistants, Preschool, Elementary, Middle, and Secondary School, Except Special Education” (25-9042).
Illustrative examples: Au Pair, Daycare Provider, Nanny
25-2010 Preschool and Kindergarten Teachers
This broad occupation includes the following two detailed occupations:
25-2011 Preschool Teachers, Except Special Education
25-2012 Kindergarten Teachers, Except Special Education
25-2011 Preschool Teachers, Except Special Education
Instruct preschool-aged students, following curricula or lesson plans, in activities designed to promote social, physical, and intellectual growth. Excludes “Special Education Teachers” (25-2050), “Substitute Teachers, ShortTerm” (25-3031), and “Childcare Workers” (39-9011).
Illustrative examples: Home-based Preschool Teacher, Nursery School Teacher, Preschool Head Start Teacher
25-2012 Kindergarten Teachers, Except Special Education
Teach academic and social skills to kindergarten students. Excludes “Special Education Teachers” (25-2050) and “Substitute Teachers, Short-Term” (25-3031)
Illustrative examples: Bilingual Education Kindergarten Teacher
Childcare can be provided to children of any age and age is only mentioned in the description for preschool teachers. Location also doesn’t seem to play a major role; childcare workers can be employed at schools while preschool teachers can be home-based. It appears that the main difference is that teachers must either teach or instruct children, whereas childcare workers provide a variety of caregiving tasks that typically do not include any instruction.
2022-12-14 · CPS
While reviewing code and analyses such as this is beyond the scope of our user support team, I was able to take a quick glance at the document. I believe the issue is that you’re using unweighted counts in your analysis when instead your averages should be weighted using ASECWT. The IPUMS-CPS samples are weighted, with some records representing more cases than others. This means that persons and households with some characteristics are over-represented in the samples, while others are underrepresented. This blog post explains how to calculate weighted averages.
2022-12-13 · CPS
You can attach a file by replying to this post and clicking the upward pointing arrow on the top toolbar. You can also email us at ipums@umn.edu. SDAWT is the name for ASECWT in the online analysis system.
2022-12-13 · CPS
The 2022 ASEC technical documentation provides additional guidance for this question. INCSSI corresponds to Q57c in the questionnaire which asks respondents to report their SSI income. In Q57a in the previous section, respondents are asked whether anyone in the household received SSI payments. This question includes an accompanying note that adds that “SSI are assistance payments to low-income aged, blind and disabled persons, and come from state or local welfare offices, the Federal government, or both.” Any state supplements to SSI therefore should be included in the amount reported in INCSSI.
2022-12-12 · USA
This 2007 Census report notes differences in geographic mobility estimates between the ACS and CPS ASEC going as far back as 2004 when the ACS estimated 5.3 million more movers than the ASEC. The paper attributes this gap to several factors aside from differences in sampling of group quarters. These include residence rules (current vs usual), reference periods (ACS is longer) and collection methods (ACS uses mail-in questionnaires), updates in the sample frame, and allocation rules. Researchers should read about the methods used for each survey to determine which aligns best with their analysis.
One additional note is that MIGRATE1 is a person-level variable. Restricting the sample to PERNUM = 1 will only tell you whether the household head moved and will not provide any information on other members of the household. This information can be informative, but since it is a person-level variable you should use the person-level weights PERWT/ASECWT/SDAWT to generate person-level estimates.
2022-12-09 · CPS
I’m glad to hear that you were able to figure out what was happening in the data. I unfortunately have been unable to replicate your results using either the microdata or the online analysis tool and would like to help figure out what is happening. In the screenshot below, I run your analysis using the means program in the online analysis tool, setting INCCAPG as the dependent variable and filtering to in-universe values, RACE as my row variable, and restricting the sample to non-hispanics (HISPAN = 0) in the 2022 ASEC. I find that White non-hispanics who earn any capital gains earn on average $23,307 as opposed to the $20,606 earned by Black respondents. Restricting the analysis to those with INCWAGE < 20000 increases the gap further: White respondents earn $20,049 while Black respondents earn $6,266. 284 of these respondents are White and 18 are Black. Please let me know if I’ve misunderstood your analysis.
2022-12-06 · International
The original shapefile images for India were obtained from the Database of Global Administrative Areas (gadm.org). IPUMS then used data from statoids.com and the Administrative Atlas of India from the 2011 Census to map boundary changes over time. Both year-specific state-level boundaries and district-level boundaries are available in GIS maps on the linked pages. These states and districts match the NSSO data provided by the MOPSI, however, in theory, they should correspond to the boundary divisions used in the census tables provided by the Office of Registrar General & Census Commissioner as long as they use the same base year. However, we cannot guarantee a complete match, specifically in the lower level second administrative units. Also, please note that codes and labels will be different.
IPUMS also created harmonized first and second level administrative units with consistent boundaries over time (you can read more about this process on the geography variables page). These will not always correspond to official boundary definitions if there were any changes, but they allow users to analyze the same area over time.
2022-11-21 · CPS
Sometimes variables are consolidated to better streamline the analysis for users. This seems to have been the case for the reason not looking for work variables you mention: WNLOOK aggregates these reasons and is available in the Basic Monthly Surveys. Other times, there are simply too many variables for IPUMS to harmonize all of them. In such cases, IPUMS will often provide an unharmonized version of the variable. In this case, UH_DWWANT_B1 provides the data available in WANTJOB for the BMS. I will see if the IPUMS CPS team would be able to provide a harmonized version of this variable, but for now you should be fine using this unharmonized variable.
2022-11-15 · General
You can find the list of all available variables on the variable selection page. They are available both alphabetically as well as by topic under the Person and Household headings. I recommend consulting these video tutorials for further help finding variables and using the provided documentation.
2022-11-15 · ipumsr
Thank you for bringing this to our attention. You should be able to view the value labels by opening the table in a new browser window by clicking the button to the right of the broomstick icon. This appears to be an issue with how the html created by ipums_view is being displayed by the RStudio viewer. I’ve submitted the issue to the IT team who will look into fixing it so that the value labels are displayed correctly within the viewer.
2022-11-11 · USA
Although 1850-1880 enumeration forms do occasionally identify ward in the city/township field, ward was not technically a field in the data until the 20th century. Since it didn’t have its own field, including it as a variable was left up to the transcriber. It was included in the transcription of the 1850 full count, but not in the transcription of the 1860 full count by ancestry.com. The 1% sample comes from an older transcription by IPUMS where ward information was preserved. There are no current plans to re-transcribe these samples. However, you might be interested in the variable ENUMDIST, which provides the enumeration district of respondents in the full count samples from 1880-1940.
2022-11-11 · USA
Hi Robert,
IPUMS NHGIS recently released the 1-year ACS Summary File data. This file provides tables of geographically aggregated summary statistics from the 2021 ACS for topics such as race, income, employment, and education among others.
The IPUMS USA team is working to release 1-year ACS PUMS (Public Use Microdata Sample) as quickly as possible; it typically takes 3-6 weeks from the Census Bureau release until these files are available via IPUMS USA. We will announce the release promptly via the IPUMS USA revision history and Twitter as well as with an email to IPUMS USA users when the data are available.
2022-11-04 · Time Use
The universe tab for EDUC notes that data is collected only for CPS household members age 15+ (learn more about the ATUS sample being drawn from households existing the Current Population Survey). The description tab for EDUC offers more detail, specifically that the variable “was drawn from the final CPS interview, conducted 2-5 months before the ATUS interview” and “not updated at the time of the ATUS interview.” EDUC will therefore only be available for respondents who have data from their household’s final CPS interview. If a household did not respond to their final CPS interview or if the respondent moved into the household between the time of the CPS and ATUS interviews, they will not have any data for EDUC.
I looked at 2021 ATUS data to confirm this universe statement. I used the variable AGE_CPS8 to get the person’s age at the time of the CPS interview (when they were asked about their educational attainment) and PRESENCE to determine if the person was present in the household for the CPS, ATUS, or both. Using AGE_CPS8 instead of AGE (measured at the time of ATUS), I can see that all 661 records over the age of 14 who are NIU for EDUC in the 2021 ATUS are only present in the household at the time of the ATUS interview. Accordingly, these individuals will not have an EDUC value as they were not in the household when the data was collected at the time of the CPS. Please follow up if you are encountering cases where the combination of AGE_CPS8 and PRESENCE do not explain the NIU cases for EDUC.
2022-11-04 · USA
The universe tab for EDUC notes that data is collected only for CPS household members age 15+ (learn more about the ATUS sample being drawn from households existing the Current Population Survey). The description tab for EDUC offers more detail, specifically that the variable “was drawn from the final CPS interview, conducted 2-5 months before the ATUS interview” and “not updated at the time of the ATUS interview.” EDUC will therefore only be available for respondents who have data from their household’s final CPS interview. If a household did not respond to their final CPS interview or if the respondent moved into the household between the time of the CPS and ATUS interviews, they will not have any data for EDUC.
I looked at 2021 ATUS data to confirm this universe statement. I used the variable AGE_CPS8 to get the person’s age at the time of the CPS interview (when they were asked about their educational attainment) and PRESENCE to determine if the person was present in the household for the CPS, ATUS, or both. Using AGE_CPS8 instead of AGE (measured at the time of ATUS), I can see that all 661 records over the age of 14 who are NIU for EDUC in the 2021 ATUS are only present in the household at the time of the ATUS interview. Accordingly, these individuals will not have an EDUC value as they were not in the household when the data was collected at the time of the CPS. Please follow up if you are encountering cases where the combination of AGE_CPS8 and PRESENCE do not explain the NIU cases for EDUC.
2022-11-04 · CPS
Hi John,
You are correct; FAMID is the family identifier that you’re looking for. It combines primary families and related subfamilies (FTYPE 1 and 3) and also identifies unrelated subfamilies, nonfamily householders, and secondary individuals as separate families per Census definitions. The method you outlined will allow you to uniquely identify families across households and samples.
2022-11-04 · USA
I recommend taking a look at this post as this issue has been brought up in the past. In short, YRSUSA1 in the ACS is derived from the year of immigration (YRIMMIG), which can easily cause a difference of 1 year depending on their age and when they responded to the ACS. The other cases are likely related to aggregation and binning the oldest years together, which are not reflected in the labels for YRSUSA1. In the 2019 ACS for example, everyone who entered the US in 1929 or earlier would have their year of entry set at 1929. You can see how these years of entry are binned by taking a look at US2019A_YOEP and the other USXXXXA_YOEP variables.
2022-11-01 · CPS
Your understanding is correct; Census determines poverty status independently for each family within a household. These families consist of an individual and anyone else related by birth, marriage, or adoption who resides with them. Importantly, unlike in the IPUMS created family variable FAMUNIT, unmarried partners are not considered members of their partner’s family. OFFPOV uses family size, total family income (FTOTVAL), and official poverty thresholds to determine poverty status. This page provides an instructive example of how poverty status is determined for a representative family.
Identifying each family presents a bit of a challenge. The best method might be using a combination of SERIAL and FTYPE (as well as YEAR and MONTH if you’re analyzing multiple samples), however you will need to pay attention to the type of family listed. Primary families and related subfamilies within the same household are treated as a single Census family. You can count the number of occurrences of FTYPE = 1 or 3 to arrive at the size of these types of families. Nonfamily householders and secondary individuals are simple to identify as they form their own one-person families. That is, family size = 1 if FTYPE = 2 or 5. Unrelated subfamilies are the most difficult as there may be multiple subfamilies within a household. In this case, you may also use OFFTOTVAL to identify members of the same subfamily as it is unlikely that the incomes of multiple unrelated subfamilies are equal. You can use CUTOFF to check your work as families of the same size should have the same cutoff values controlling for whether the householder is under 65.
2022-10-28 · CPS · marked as solution
You are not misunderstanding the MISH variable or month-in-sample concept; this is an error in the original data. This issue has been identified by the IPUMS CPS team in every even-year CPS-ASEC file since 2016 and has been fixed up to the 2020 ASEC, with a fix for the 2022 sample now in the works. The description tab for MISH notes that records in the Census Bureau CPS-ASEC PUMS files in these years have month-in-sample values that do not correspond to these record’s values in the March basic file. IPUMS CPS corrects the March basic monthly respondent’s month-in-sample values to match the March basic monthly file values. Specifically, the fix adds 4 to 2022 ASEC MISH values under 5.
Thank you for bringing this issue to our attention. We really appreciate it when users help make IPUMS data and documentation better for all. As a token of our thanks, we would like to send you an IPUMS mug. Please send us an email at ipums@umn.edu with a mailing address so that we can ship one to you.
2022-10-27 · CPS · marked as solution
Thank you for bringing this to our attention. It does appear that these labels were inadvertently switched. In the 2011-2019 samples, OCC = 6530 should refer to structural iron and steel workers while OCC = 6540 are solar photovoltaic installers. I have alerted the CPS team to this issue so that it can be addressed.
2022-10-27 · USA
FDSTPAMT is a household-level variable and provides the dollar amount of the value of food stamps received by all members of the household during the past 12 months. A value of 1 indicates that the sum of all food stamps received across all household members over the past 12 months was $1. The household you cite that reports receiving $17,000 in food stamp benefits has 16 members who are noted as food stamp recipients. This additional information makes the 17,000 figure plausible. Note that a household includes everyone living at a given address, including tenants, regardless of whether the members are related or not. Note additionally that the ACS is a self-reported questionnaire. This Census Bureau paper documents issues with underreporting food stamp benefits, which may have been one of the reasons that the question was dropped by the 2008 ACS.
2022-10-17 · General
OCC provides the unharmonized year-specific occupation codes for sample respondents. The same codes will correspond to different occupations across years. For this reason, it’s not possible to provide consistent labels for OCC. You will need to refer to the list of occupations to cross-reference the codes for OCC for each sample year.
If you plan to analyze occupation across multiple years of data, you may be interested in one of the IPUMS created harmonized occupation codes (i.e. OCC1930, OCC1950, OCC1990, and OCC2010). While each of these variables classify occupations based on their own year-specific scheme, they group similar types of work across years as new occupations appear and old ones become obsolete, allowing researchers to examine changes in labor over time. The process for creating these variables is discussed further in the user guide on integrated occupations.
2022-10-17 · CPS
Thank you for bringing this discrepancy to our attention. The IPUMS CPS team discovered the unused codes and ASEC notes reflect a less detailed version of the RELATE variable that we are no longer using; we will remove the obsolete codes and update the documentation accordingly. For more information on family pointer variables, I recommend consulting the pointers page on the IPUMS CPS website as well as this MPC working paper on their construction; table 4 of the working paper highlights the linkages for parent-child assignments in IPUMS CPS.
2022-10-11 · CPS
Those coded with a 1 for WHYUNEMP are temporarily laid-off workers. They may or may not be searching for other work since they are expected to be recalled by their employer at a later date. Those with one of the remaining in-universe codes (i.e. 2-6) however must be searching for work. Using UH_LK_B1, you will find that many of the temporarily laid-off workers do in fact report searching for alternative work as well. It is up to the individual research whether to include these respondents in the unemployed and looking for work population. I hope that helps clarify things.
2022-10-11 · USA
You can find the names of these counties in this document. However, you should note that these counties have no matches in the 1870 shapefiles because none of them actually existed in that year. With nearly all of these codes, I suspect the issue is likely due to miscoding in the microdata such as premature identification of counties that weren’t yet legally instituted or that were only ever in informal use. I’m not certain if this is the case for these codes, but such issues are a reality when working with the historical microdata.
2022-10-04 · CPS
WHYUNEMP (reason for unemployment) should give you the data that you’re looking for on job searching. While temporarily laid off workers are considered unemployed in EMPSTAT regardless of whether they were searching for a job, WHYUNEMP distinguishes between unemployed respondents who were on temporary layoff (Job loser/ on layoff) and those who were unemployed and looking for work (codes 2-6). You may also be interested in the unharmonized variable UH_LK_B1, which further distinguishes between respondents who were and were not searching for work. This forum post goes into further detail on these variables and explains how definitions used to construct them have changed over time.
2022-09-29 · CPS
NCHLT5 is assigned using IPUMS created family interrelationship variables MOMLOC and POPLOC. MOMLOC indicates whether the respondent’s mother appears in the same household, and if so, reports the mother’s person number (PERNUM). POPLOC does this analogously for the respondent’s father. You can read about how IPUMS constructed these family linkages in the documentation on new family interrelationship variables as well as in further documentation provided on the IPUMS USA website.
Finding the number of children under 18 in the household for each respondent will require you to count the number of times their PERNUM appears in MOMLOC or POPLOC for individuals within the household under the age of 18. Example #6 in this Stata blog post works through a solution for this type of problem. Note to restrict your matches to those under 18 years of age as MOMLOC and POPLOC report family interrelationships regardless of age.
2022-09-28 · General
While I can’t recall any examples off the top of my head, you can look for research using machine learning on the IPUMS bibliography database. The Methodology and Data Collection topic may provide the most relevant results.
2022-09-28 · Health Surveys
Thank you for letting us know about your interest in the microdata extract API for IPUMS NHIS. This is something that is definitely on our radar that we hope to be able to provide in the future. However, as of now we don’t have a firm timeline for when we would be adding this feature.
2022-09-27 · General
My apologies for the delayed response Joseph. To limit your extract to include only respondents from New York State you’ll need to first add the variable STATEFIP to your cart. Then finish creating your extract and click the Select Cases option from the Extract Request page (see the screenshot below). You will be able to filter by checking the box next to STATEFIP and highlighting 36 New York. This IPUMS CPS tutorial video goes through the extract system step-by-step, including showing how to select cases, and should be a helpful reference if you find yourself stuck.
2022-09-27 · USA
Hi Casey,
The extract system can only provide you with microdata where either each observation is an individual respondent or with responses on the household level. Once you have the microdata, the only way to obtain aggregate counts is for you to aggregate these responses to the enumeration district level yourself using a statistical software such as Stata or R. The egen command will help you sum observations by group in Stata, while aggregate will do the same in R. This is my recommendation since the alternatives I outline below may not be ideal. Note that ENUMDIST needs to be combined with STATEICP to uniquely identify districts across states.
One of these alternatives is the online analysis tool. It requires you to analyze the 1880 10% sample rather than the full count file. Since there are many enumeration districts across states, you will likely need to generate separate tables for each state. To do so, enter ENUMDIST into the Row field, RACE into Column, and STATEICP(1) into the Selection Filter. Make sure that perwt is selected and click to run the table. This will generate weighted counts by race by enumeration district for the given STATEICP filter. You will need to re-run the table for each state of interest. Another alternative is to get aggregated data from IPUMS NHGIS, however the lowest level for which data is available for 1880 is on the county level.
2022-09-23 · USA
Three different types of income were recorded for sample-line respondents in the 1950 Census: Salary and Wage (INCWAGE), Business and Farm (INCBUSFM), and Other (INCOTHER). Each of these correspond to questions 31a, 31b, and 31c respectively. Their sum is the variable INCTOT (total personal income). The questionnaire text for US1950A_1086, the source variable for INCWAGE, specifically mentions entering “None” as an option. However, as a business operator, their income from the business should be recorded in question 31b rather than 31a. The notes at the bottom of the questionnaire page specifically state that salaries that business owners pay themselves are not included in the value for Q31a.
As for the notes that read “9V”, this was an internal code by the census bureau used for rounding incomes above $10,000 while “00” refers to no income. However, this seems inconsistent with the “None” box being checked for 31a and may be due to an error by the clerk or enumerator. Since it can be difficult to comment on the exact transcription of individual records, you’re more than welcome to send an image of what you’re seeing to our user support team at ipums@umn.edu and we can take a closer look to see if there is a systematic issue that we can document.
2022-09-16 · General
To open the data in Excel, you’ll need to revise your extract and change the data format to comma delimited (.csv). From the My Data page, click revise under Revise Extract. Then, follow the steps in this video tutorial (starting from 10 seconds in). I hope that helps.
2022-09-16 · General
You will need to use a statistical package such as Stata, SAS, SPSS, R, or Excel to open and view these data.
2022-09-16 · General
Hi Joseph,
I was able to download your extract and the data was in the .dat.gz file. Could you tell me which statistical software you’re trying to open the data in and which folder you’re downloading the data to? Depending on the software, you should follow the corresponding online video tutorials and download the data to a folder you can access.
2022-09-16 · General
It sounds like you received an email about your data extract being ready for download, but that you were unable to download it. Is that correct?
If so, you should be able to download the file by logging into your account on IPUMS USA and navigating to the My Data page (see below). Once there, click the green Download .DAT button and extract the file to a working folder. If you’re not seeing any extracts on this page, try clicking on Show All on the far right. If there is an extract but no green download button, you will have to click Resubmit and wait for your file to be prepared. Once you’ve downloaded and extracted your file, use the provided command files to input the data into your statistical package of choice. You may find these online tutorials helpful if you encounter any difficulties.
2022-09-14 · USA
I compared the questionnaire text and variable descriptions for INCRETIR in the ACS and the mentioned CPS variables. Based on this review of the documentation, I think INCRETIR [ACS] can be approximated as the sum of INCRET1 [CPS], INCRET2 [CPS], INCSURV [CPS], INCDISAB [CPS], INCPENS [CPS], and INCRANN [CPS] in 2019. However, there are a few other issues you should consider:
-
INCRET1 and INCRET2 only contain information about the first two sources of retirement income. Income from all retirement sources in the CPS is contained in INCRETIR. However, this variable in the 2019-2021 ASEC is only asked of persons age 58+, whereas INCRET1 and INCRET2 have a universe of persons aged 15+. You may want to compare the differences in these variables across respondents who reported information for both to get a sense of how much income you may be missing from third and latter sources of retirement income.
-
The ACS is fielded on a rolling basis and references the previous 12 months while the CPS ASEC asks about the previous calendar year. As a result, the ACS will include income from both the current and previous years.
-
The top allowable value for INCRETIR in the ACS (2003-onward) is the 99.5th percentile in each state. In 2019, this varied from $100,000 - $208,000. Meanwhile, the CPS ASEC retirement income variables each have top codes at $999,999. You can find the list of ACS top codes here.
-
The CPS relies on interviewers to ask questions, while the ACS is a self-administered survey. Interviewers may help respondents recall different sources of income and categorize them appropriately; however, the specificity of the income sources asked about in the CPS and availability of an enumerator to help categorize income sources may also allocate certain income to INCOTHER in CPS that an ACS respondent would categorize as retirement/disability/survivor’s.
2022-09-13 · Time Use
I agree with your assessment that the WHO data is unlikely to capture household members who are present, but not participating in the activity with the respondent. Unfortunately, there is no other way to track how long other household members were at home during the day if they did not participate in activities with the respondent.
You might however be interested in taking a look at the National Couples’ Health and Time Study (NCHAT). One distinction that it makes is that it asks respondents both who was present during an activity and who was directly involved in it. Note that the NCHAT only asks questions from the main couple and not of any other household members.
Outside the US, there are a number of countries that have their own time use surveys, which are included as part of IPUMS MTUS. Many of these survey multiple household members. Although I’m not certain if any record time use in a way that’s helpful for your research, having multiple respondents might give you a better sense for time spent at home with others.
2022-09-09 · General
The Puerto Rico sample is administered separately from the ACS as part of the the Puerto Rico Community Survey (PRCS). Data is available on the IPUMS USA website. From the main page, you’ll want to select Get Data and then click on the Change Samples button on the top right. Finally, select the tab labeled Puerto Rico and check the samples that you want to include in your extract. You might additionally find the user guide and the accompanying video tutorials helpful.
2022-09-08 · Time Use
Hi Assaf,
Thank you for your patience. This is a difficult question, so we wanted to get it right. If you want to account for all time spent by respondents with children, you will definitely want to consider childcare provision instead of using only the “with whom” feature of the Time Use Variable (TUV) builder. While this feature allows you to select time spent by relationship and age (in the case of own household children), it will not capture all time respondents spent with children. This is because respondents often omit children from the list of people who they participated in the activity with if the activity name directly mentions children. This is particularly true in cases of secondary childcare; parents may view the question of who they are participating in the activity with as asking who is helping them with childcare and implicitly exclude children.
I can think of two different options for trying to capture all time spent with children: using the tool to create multiple TUVs that are mutually exclusive and summing them in your stats package, or requesting a hierarchical file and writing the code to build your own TUV. If you decide to keep using the tool, you will want to create three separate TUVs: a) All activities that respondents report spending with their child under 18, b) all activities that are directly related to the care of children under 18, but the respondent does not report being with a child under 18, and c) all instances of secondary child care where the respondent does not report being with a child under 18. Note that each of these methods will define “children” differently. The with whom feature is based on a specific relationship between the respondent and the other person(s) present during the activity. In contrast, primary activity codes for providing child care only specify with household children or non-household children (i.e., they are not contingent upon the relationship between the respondent and the child), and there are a number of different secondary child care measures to choose from. Additionally, you should look at the age restrictions for each measure. Once you’ve downloaded the data, sum the values for each of the three cases together. This will be the total time sample respondents spent with children.
To restrict your TUV more narrowly based age and relationship combinations, you could instead create a hierarchical extract with the variables ACTIVITY, DURATION, RELATEW, AGEW, as well as the secondary childcare measure(s) of interest. I also recommend taking a look at the ATUS training materials, which include exercises on creating TUVs from hierarchical files and another for thinking about childcare
2022-08-29 · IPUMS API
This is not currently an option using the API. However, I’ve alerted the IPUMS microdata API team that there is interest and hopefully we will be able to offer this type of functionality in the future.
2022-08-26 · CPS
Hello, apologies for the long wait. You’re correct that the current note does not reflect the data on the website. The CPS team is currently looking into how the relationships between these individuals and the household head were established, however this will take some additional time. Thank you for your patience and I hope to be able to provide an update in the near future.
2022-08-25 · CPS
It sounds like you’re interested in the total number of children across households at this stage rather than the number of children individual household members have. NCHLT5 is useful in analyzing the latter (e.g. finding the number of people with at least one child under 5), but since different household members will have varying responses for NCHLT5, it’s not particularly helpful in estimating the former. Instead, I recommend using the variable AGE to identify records of children under 5. While this variable won’t tell you who the parent is or how many children they have, summing the number of observations across the entire sample for which AGE < 5 will give you a consistent unweighted count of the total number of children.
More specifically when you produce your weighted estimate, instead of filtering to keep one row per household, you’ll want to filter to keep every row where AGE < 5. Since you’re generating point estimates from 12 months of pooled data, you should then divide WTFINL for each observation by 12. Now you can finally sum WTFINL for all of the remaining observations, giving you the weighted total number of children. You may also be interested in the survey package and the function surveysummary, which allows you to produce weighted estimates from survey data without needing to sum the weights yourself. However, you will still need to divide WTFINL by the number of months that you pool. Note that for the most accurate comparison with Census 2021 (American Community Survey) estimates, you’ll want to use the January-December 2021 CPS. Also, keep in mind that the CPS is a survey of the non-institutionalized US population whereas the ACS has no such restrictions.
I mentioned that AGE won’t tell you which record represents the parent of the child under 5, but you can use the attach characteristics tool to add variables in your data cart for both the child’s father and mother, such as LABFORCE and INCTOT, to the child’s record. You can then choose to not only count the total number of children under 5, but also filter by children whose mother/father is in the labor force and/or their total personal income. This tool is available on the extract request page once you’ve opened your data cart and selected to create your data extract. Note that the tool uses the IPUMS constructed variables MOMLOC and POPLOC to connect records. If you plan to use these, I strongly recommend reviewing the description and comparability tabs for these variables as well as the original documentation for family interrelationships and documentation on the updated pointers.
2022-08-23 · CPS · marked as solution
While it’s true that a monthly value for HOUSSUB would contrast with other annually reported variables such as those for income, this doesn’t seem all that surprising since rents are commonly discussed in terms of monthly values. Contract rent in the ACS for instance is reported as a monthly amount. The fact that it is noted in the codebook is a strong indicator in this direction. My earlier statement was about being unsure of how this monthly amount was determined, but after some more digging I found that this 2010 census working paper describes the process in some detail. While the ASEC does not report either the actual rent or the market rent, the paper provides its own estimates of average housing subsidies. I was able to get close to the $2,591 value at the bottom of figure 1 in the paper after multiplying my estimates from the 2009 ASEC by 12, again suggesting that HOUSSUB is a monthly value.
An alternative measure that you may consider using is SPMCAPHOUS, which reports an annual rather than monthly amount for housing benefits. SPMCAPHOUS however calculates these benefits for Supplemental Poverty Measure (SPM) units, which can be larger than family units used for HOUSSUB and for the Official Poverty Measure. Using the 2013 ASEC, I was able to arrive at the $4,716 average housing benefit provided in table 1 of this 2015 census working paper, which also notes a monthly value of $393.
Thank you for highlighting this gap in the documentation. I will suggest making a note of this for the next release. If you’re looking for any additional documentation, I recommend reaching out to Census at dsd.cps@census.gov.
2022-08-17 · USA
Most often, an individual’s occupation is labeled “Not yet classified” due to unclear, illegible, or low frequency strings that we don’t have the resources to code for at the time. OCC codes can then be reassigned in the historical data depending on what information can be gleaned from the occupation string, as well as a number of other variables including industry, class of worker, and occasionally sex and relation to the household head as well. In other cases, we might have a legible and common enough occupation, but it’ll be labeled “Not yet classified” if the occupation seems out of place given the other available information. In these cases, we review these other variables to help classify the occupation code. We do not use data from other decennials via the IPUMS Multigenerational Longitudinal Panel in this process. With revised versions of the historical full count files, the IPUMS historical team has introduced new coding rules to decrease the number of cases of not yet classified occupations. You can find notes and guidelines for coding occupations from each sample on this page.
2022-08-11 · USA
Yes, observations with OCC = 979 in the 1880 full count are those that have not yet had their occupations assigned. This happens if the reported industry or class of worker doesn’t match the occupation; in these cases, we review and potentially reclassify the occupation code. The IPUMS historical team is currently working on a revised version of the 1880 full count file that will include updated OCC codes. Many of the 979 codes are likely to be assigned to one of the non-occupational responses; these are represented in the 1880 full count by OCC codes greater than 300 and include broad categories of non-employed statuses such as “keeping house”, “student”, and “institutional inmate”. You’ll also notice that the majority of these observations have already been assigned similar non-occupational codes for OCC1950. I hope this information proves helpful!
2022-08-09 · Time Use
-
The weights are not set in the command file. After setting the data, you need to include [pw=wt06] every time that you run a regression in which you want the results to be weighted and representative of how the population spends their time. Alternatively, you can run the command svyset [pw=wt06] so that stata remembers to weight all of your future estimates.
-
Yes, you will want to separately account for primary and secondary childcare since some respondents omit the with whom variable for these categories. Note that spending time with a child does not mean the individual is under 18 years older. Rather, it means they are the respondent’s child. In fact, the with whom option is not particularly helpful if you’re looking for all time spent with those under 18 since brothers, sisters, grandchildren, and other related people can all be under 18. I recommend instead creating a data extract with the variable AGEW to filter with whom by age rather than relationship.
2022-08-09 · Time Use
Hi Assaf,
I hope I can help.
-
Weights are briefly summarized on the FAQ page. In general, you should use WT06 together with the replicate weights found in RWT06 for empirically derived standard errors. There is sample code for replicate weights on the CPS replicate weights page. You should use WT20 together with RWT20 when analyzing the 2020 sample. All of the weights are probability weights. In stata, you would run your regression with [pw=wt06].
-
Finding total time spent with children can be tricky. You’ll need to use AGEW to examine the ages of people the respondent engaged in activities with. Summing the number of occurrences of AGEW < 18 and tabulating them by HH_CHILD, you should find that among ATUS respondents in 2019-2021 with household children only about 5% did not engage in any activities with children under 18. Taking it a step further, respondents engaged in primary and secondary childcare sometimes omit that they were with a child at the time. When including households with ACTIVITY codes 30100-30399 (primary childcare for household children) and positive values for SCC_HH_LN (secondary childcare for household children), you should find that less than 5% of respondents in households with children report not being engaged in either primary or secondary childcare or any other activities with those under 18. This seems reasonable considering the respondent is a random member of the household.
2022-08-05 · NHGIS
The currently available per capita income time series covers the years 2000, 2008-2012, and 2015-2019. I recommend selecting County under Geographic Levels and Per Capita Income under Topics while leaving Years blank. There is a time series tab where you will find it. The aggregated 5-year data (2008-2012 and 2015-2019) combines five years of ACS estimates of the average per capita income for the previous 12 months. That means the 2008-2012 data will be centered around the start of 2010 and the 2015-2019 series on 2017. Alternatively, you can get estimates for individual years to construct your own time series going from 2010-2019 through source tables using 1-year ACS estimates. There are no 1-year ACS estimates between 2005-2009, so you would still need to use either the 5- or 3-year tables that are provided. IPUMS NHGIS has no estimates for the years 2001-2004.
2022-08-05 · USA
I suspect the issue is that you need to update your command file (.sps) to reflect your working directory where the data file is stored. You’ll want to edit line 5 of the idhs .sps syntax file to show the location of your working directory and only then run the entire file. You’ll also want to ensure that you have correctly unzipped the data file. We recommend using 7-Zip for windows users.
You can also generate a data file that can be opened directly in SPSS without the use of command files. To do this, you will need to change the data format from the extract request page (screen shots below).
.
2022-08-03 · USA
Yes, you can directly use PERWT for the 2020 5-year data and ignore EXPWTP. This is because PERWT and EXPWTP are identical in all ACS samples for 2020 (1-year and 5-year 2020 samples); they both report the covid adjusted experimental weights. It became necessary to release EXPWTP as a separate variable from PERWT when the census bureau created experimental weights for the 2019 1-year ACS. Since PERWT and EXPWTP differ in the 2019 1-year ACS, users now have the choice to run their analyses of this sample using either weight. This is significant because previously the 2020 experimental weights presented estimates that were not directly comparable to those from previous years. Using the 2019 experimental weights, researchers now can directly compare between estimates from the 2019 and 2020 ACS. In your case, the 2020 5-year ACS file will use standard weights for 2016-2019 subsamples and covid adjusted entropy-balanced weights for the 2020 subsample for both PERWT and EXPWT. If you would like to use the 2019 experimental weights, you will need to obtain them separately by downloading the 2019 1-year ACS file.
The Census Bureau traditionally uses a median CV of 0.30 at the Census Tract Level as a benchmark to determine whether or not to publish estimates. State or national estimates will correspond to a much lower CV. It is still up to the researcher however to determine whether a particular estimate is sufficiently precise for their application.
2022-07-15 · CPS · marked as solution
-
Neither ASECFWT nor ASECWT are designed to work with tax units and will need to be modified to run the type of analysis you mention. ASECFWT will work only in cases when the family is equivalent to the tax unit. However, since a family includes all members related to the household head, a family may also have multiple tax units within it. This report details how the census bureau attempts to identify tax units for its model. For example, a family consisting of a married couple and an adult child may have two tax units if the adult child files single rather than being listed as a dependent. You will therefore need to drop families with multiple tax units in order to run your analysis with ASECFWT. This should hopefully not pose too many issues since the majority of families will form a single unit, but I recommend keeping track of how many are dropped and what their characteristics are. Once you drop these observations, you will also want to restrict your analysis using ASECFWT to one individual per family/tax unit so as to not count each unit multiple times.
-
Yes, you should assign them as probability weights.
-
Yes, replicate weights are only available beginning from the 2005 ASEC sample. If you aren’t using replicate weights, please be aware that your standard errors will be less accurate. You might be interested in a set of papers by Davern et al. (2006, 2007) which propose a method to improve estimation of standard errors in ASEC data without replicate weights.
I do want to point your attention towards the tax variables already available in the ASEC on IPUMS CPS since these are calculated by the CB in a manner similar to TAXSIM.
2022-07-15 · Health Surveys · marked as solution
A note of caution that comparisons of conditions across the two classifications, even those represented in both the IDD9 and ICD10, are challenging. I’m attaching a slidedeck from the most recent MEPS workshop that covers this issue. Specifically, slide 8 demonstrates an example of how changing to the new coding scheme has affected reporting. You can use the MEPS data tools website to look at the estimates for other conditions to see how they might be affected by the switch (click medical conditions, number of cases).
Hope this helps.
3_Medical Conditions March 2022.pdf (683.2 KB)
2022-07-11 · CPS
I should specify that dividing by the number of samples is only necessary if you’re looking to find population-level totals (e.g. the number of black men aged 24-34 in the labor force in Alabama). It will not affect your estimates of ratios (e.g. the labor force participation rate for black men age 24-34 in Alabama).
WTFINL estimates the number of people from the population represented by a specific observation in your sample. Suppose that summing WTFINL across all black men aged 24-34 in the labor force in Alabama in January 1980 gives you an estimate of 200,000. This tells you there were approximately this many people in this group in January 1980. Now suppose your sample consists of all basic monthly surveys in 1980 and you sum WTFINL across your population of interest. You may find that the sum is now 2,400,000 and erroneously conclude that this is the size of the population. However, you’ve simply aggregated estimates from all of the months into one figure. Dividing by the number of samples, 12 in this case, will give you the average size of the population across the year. This isn’t necessary when calculating ratios because both the numerator and denominator will be inflated equally.
2022-07-08 · Health Surveys
You can find the general equivalence mapping (GEM) between ICD-9-CM and ICD-10-CM codes on the NBER Public Use Data Archive. Note that one ICD-9-CM code can often translate to several ICD-10-CM codes since the latter codes describe more specific conditions.
2022-07-08 · USA
Hi Tom,
Currently, VALUEH incorporates labels from all available samples. This is resulting in you seeing intervals in your labels even though the variable description for VALUEH notes that the variable should be continuous without intervals from 2008 onwards. It shouldn’t however impact your analysis since the actual values are correct.
One possibility of what might be happening is that your observations are on the person-level, but you are creating your deciles on the household-level. Since households will have different numbers of person-level observations, the size of these household-level deciles will vary. Since VALUEH will be the same across household members, I recommend keeping one observation per household and dropping the rest. Usually this is done by keeping observations with PERNUM = 1. You will also want to use HHWT as your weight to generate deciles that are representative of your sample of interest.
2022-07-07 · CPS
The CPS team took a closer look at WKSWORKORG, but unfortunately wasn’t able to find a conclusive reason why there are such a number of NIU observations. The codebooks just say the universe should be respondents who are paid annually (UH_ERNPER_B1 == 6). The question about how often they were paid was asked of all ORG respondents (i.e. employed, but not self-employed, civilians age 18+). However, that leaves 20-30 who have responses despite not meeting those criteria (not paid annually specifically) and 400-600 each month who do not have responses even though they fit the bill. This appears in the original data and is most likely the result of the Census Bureau applying a universe whose rules were not made (easily) available. Hope this information is useful.
2022-07-06 · General
Hi Michiel,
Thank you for noting this error in the documentation. The sample information currently only reflects the 1983 survey. District information is indeed available for all samples of the India employment survey aside from the ones fielded in 1983 and 1993. You can find the list of all unharmonized geography variables for your selected samples on this page. You can also use the harmonized second-level geography variable GEOLEV2. Further information about the harmonization process is provided. The estimates you generate using the weights should be representative on the district level, although the variance of your estimates will be inversely proportional to the sizes of your subsamples.
2022-07-06 · CPS
I’m not exactly sure what you mean by a formal job change, but a change in occupation codes could signify several different possibilities. The individual could have had a change in occupation due to switching jobs between firms, changed their job within the firm, or have had the main duties of their job within the firm altered. Moreover, if the occupation code is the same, this does not mean that the respondent was continuously employed. They could have transferred from one firm to another, but have kept the same occupation across firms.
Instead of using the ASEC longitudinal samples with OCC, you might find using EMPSAME together with the Basic Monthly Surveys more conducive to answering your research question. EMPSAME reports whether the respondent was employed by the same employer and had the same job as their main job in the previous month’s survey. Since the CPS is a rotating panel, you will be able to link individuals and their responses to EMPSAME across months within a 16-month period (more on the rotating panel here). If you decide to use EMPSAME, please note the issue of not-in-universe observations described on the variable page.
Additionally, you might also be interested in looking at the Job Tenure & Occupational Mobility Supplement (asked in January in every even year). JTYEARS, available in this supplement, reports the number of years the respondent worked in their current job. More specifically, it asks for “how long the respondent has been working continuously for their current company or as a self-employed person at their main job for their present employer”. If you do plan to use this supplement, please review the notes IPUMS CPS provides for it.
2022-07-06 · CPS
While I’m unable to review your specific code, I was able to create an extract combining all of the 1980 Basic Monthly Surveys. Using it, I got an estimate of 1,519,989 for the number of employed people in Alabama together with a labor force participation rate of 57% and unemployment rate of 10%. Given the additional adjustments the BLS does in calculating unemployment rates, this lines up very closely to estimates provided by FRED. Below is the code that I used. Note that you’ll want to divide your weights by the number of samples (in this case I divided them by 12). As for your second question, you will observe that the smaller your subsample becomes, the less precise your estimates regarding that subsample will become. This shouldn’t present any significant issues for finding, for instance, a breakdown of the state unemployment rate by race. If you decide to refine your subsamples further, I would recommend paying attention to the variance of your estimates.
gen employed = 0
replace employed = 1 if classwkr != 29 & (empstat== 10 | empstat==12)
egen stateworkers = sum(employed * wtfinl/12), by(statefip)

gen unemployed = 0
replace unemployed = 1 if empstat == 20 | classwkr == 29
egen stateunemployed = sum(unemployed * wtfinl/12 ), by(statefip)

gen state_unemploymentrate = stateunemployed/ (stateworkers + stateunemployed)

gen lf = 0
replace lf = 1 if labforce == 2
egen statelf = sum(lf * wtfinl/12), by(statefip)

gen nilf = 0
replace nilf = 1 if labforce == 1
egen statenilf = sum(nilf * wtfinl/12), by(statefip)

gen state_lfpr = statelf/ (statenilf + statelf)
2022-06-30 · USA
The questionnaire text for PAIDGH is direct that this refers to health insurance premiums. The question asked of respondents is whether their employer or union paid for all, part, or none of the health insurance premium. A google search shows a number of companies who offer to pay their employees’ insurance premiums in full. I looked at the 2021 ASEC and found nearly 9000 in the sample who indicated full premium coverage by their employer or union; the industries with the largest proportions of their workers having full premium coverage were motion pictures and video industries (19%), executive offices and legislative bodies (16%), and legal services (15%). Those with the lowest were nail salons and other personal care services (1%), beauty salons (2%), and private households (3%). These groups seem reasonable to me at first glance.
2022-06-30 · Time Use
The availability tab for BTHPL shows that this variable is currently only available for four samples: Canada 2015, Israel 1991, Italy 2008, and United Kingdom 2014. Moreover, only the UK 2014 sample allows for responses from a sizable number of countries.This is why you’re not seeing as many countries being represented in the MTUS. While included in the questionnaire, the BTHPL variable was not consistently offered in the version of the ATUS data that IPUMS MTUS uses (as well as a number of other time use surveys included in MTUS). However, the IPUMS Time Use team is planning to include this variable for ATUS samples in a future MTUS release, and hoping to make BTHPL available for other samples (new and previously released) if we can secure the corresponding/relevant/more detailed version of the original data.
2022-06-24 · CPS
Hi Kimberly,
I previously mentioned that you should use PAIDHOUR to define the universe for UHRSWORKORG. However, UH_ERNPER_B1 = 1 is the correct way to define being “paid by the hour”. PAIDHOUR includes not only those who are paid by the hour, but also those who provided an hourly rate even though they were not paid by the hour. This is noted on the variable description page for UHRSWORKORG. Using UH_ERNPER_B1, I’m finding only 253 observations (0.45% of the sample) that are not-in-universe in a sample of all 2021 basic monthly surveys.
For WKSWORKORG, you will want to restrict your sample to UH_ERNPER_B1 = 6. Respondents in both MISH 4 or MISH 8 should be eligible for WKSWORKORG. With this, you should be left with 6,812 cases (16% of the sample) with not-in-universe values for the 2021 BMS sample. I hope to have more information about WKSWORKORG soon that will help decrease the number of these observations even further.
2022-06-24 · CPS
If you’re interested in getting data on the 2018 split panel households, you can access the microdata files directly through the Census Bureau website.
2022-06-24 · IPUMS API
Thank you for mentioning your interest in this type of functionality. I’ve communicated your suggestion to the API team. Unfortunately, this is not something the API is currently capable of and is likely outside the scope for the core project.
2022-06-23 · CPS · marked as solution
Let me answer your questions in order.
-
The IPUMS CPS team is reasonably confident that the cause of this discrepancy is the 2018 split panel survey. In 2018, about 5,000 households in the ASEC sample were randomly assigned to receive an alternative questionnaire which replaced the health insurance coverage questions with the ones that were used prior to the 2014 CPS redesign. According to the accuracy statement, about 4,200 housing units were determined to be eligible for interview and about 3,500 interviews were obtained. This lines up with the 8,665 observations from the 3,494 households that constitute the gap in sample sizes. Since these households received the same March Basic questionnaire, but a different ASEC questionnaire, they are not included in the ASEC files harmonized by IPUMS. The team is considering adding these files at some point in the future.
-
MARBASICIDP is currently not available for March 2021. The CPS team is currently working on making it available to users. As an alternative, you can use CPSIDP to link individuals between the March Basic and ASEC surveys.
2022-06-22 · CPS
The Census Bureau does not revise past years’ weights after the release of new population data. This new data may slightly affect population estimates for previous years; for example, the average absolute difference between the 2010 population estimates and 2010 Census counts was 3.1 percent across all counties. However, this change has not necessitated Census to offer readjusted weights or to recommend researchers to adjust the weights themselves. Moreover, the weighting process as described in the technical documentation has multiple stages and requires additional information generally not available to researchers. You should have no problems using ASECWT for your analysis. Please keep in mind however that the 2022 sample is the first to use the blended 2020 population base. For this reason, you should be cautious and avoid directly comparing population totals from the 2022 data with previous years.
2022-06-16 · CPS
You should be able to simply use WTFINL without any additional modifications. WTFINL provides the number of people that a given individual represents from the surveyed population. Even though you’re selecting a subset of the population (i.e. teachers), the sum of their individual weights should approximate the total number of teachers in the given sample year.
I recommend paying particular attention to your sample sizes and standard errors when analyzing small subsets of the population (e.g. when crossing detailed occupation and jobholder status codes). With small sample sizes, you will have a lot of random sampling variation from year to year. If you find this to be an issue, you can combine similar occupation or multiple years of data to increase your sample sizes.
2022-06-16 · CPS
As an alternative, you might be interested in using UHRSWORKT and AHRSWORKT (available in all BMS samples) or UHRSWORKLY and WKSWORK1 (available in ASEC samples) to estimate hours worked. These have fewer universe restrictions than the earner study variables. This page compares all of the mentioned hours worked variables.
2022-06-15 · USA · marked as solution
The online guide notes that confidence intervals using the SDA system are only available for percentages. As you state, adding percentages by migration category across years doesn’t make much sense since you’re analyzing net migration over time. For this reason, you’ll want to generate percentages across rows and calculate confidence intervals from there. Alternatively, you can calculate your own confidence intervals by downloading an extract with the above samples and variables directly from IPUMS USA.
2022-06-14 · USA
Unfortunately, it’s not possible to create a variable that only shows net migration. Such a variable would require summing across individuals (immigrants minus emigrants), which the SDA system is not equipped to do. You can create a variable that’s an indicator for whether an individual is a migrant to/from San Francisco County and have both values appear in one table, but there’s no way to make the output be solely net migration.
Here’s an example where the new variable, SFMigrate = 1 for immigrants, -1 for emigrants, and 0 for all others.
if (migrate1d eq 24 OR migrate1d eq 31 OR migrate1d eq 32 OR migrate1d eq 40)
   if (city eq 6290)
      SFMigrate = 1
   elseif (migplac1 eq 6 AND migpuma1 eq 7500)
      SFMigrate = -1
   else
       SFMigrate = 0
   Endif
else
   SFMigrate = 0
2022-06-14 · NHGIS
The -1 value in the census tract Sex by Race table is an indicator for data suppression. The Bureau used suppression in 1970-1980 to maintain respondent confidentiality. The Bureau put a -1 (or -2 value) in the first cell of a tabulation to indicate suppression, and then they “blanked” out the remaining cells in the tabulation. For more information about 1970 suppression, see pages 189-190 of 568 in this PDF.
2022-06-14 · International
The data that was shared with IPUMS was missing all observations from provinces in Kalimantan, Sulawesi, Maluku, and Papua. This was not the result of any additional trimming on the part of IPUMS. The original survey included 206,484 households, but on account of these missing observations, there are currently only 166,033 households in the sample. The documentation that was shared does not mention these missing observations, but it’s unclear at what stage these observations were lost. I’d really appreciate it if you could point me to the scholars you mention who use microdata from the 1995 SUPAS from these provinces. The IPUMS International team is always looking for opportunities to add data and this may be a good opportunity to update the sample.
2022-06-10 · CPS
The universe for UHRSWORKORG is “employed civilians 15+ in outgoing rotation groups that were paid by the hour. Excludes self-employed persons.” Therefore, in addition to excluding workers based on EMPSTAT and MISH, you should also use PAIDHOUR and CLASSWKR. Doing so for the 2021 BMS files results in about 25% of the sample being not-in-universe. The universe for WKSWORKORG is “civilians 15+ currently employed as wage/salary workers and in 2 (out of 8) rotation groups and is paid annually. Excludes self-employed persons.” Therefore, you also need to consider the number of months an individual appeared in the survey when examining the universe for the variable. Doing so should reduce the percent of your sample that is not in the universe. That being said, there are still cases that I would expect to be in universe based on the provided definition that have NIU codes. We are looking into this further and will provide an update when we know more.
2022-06-07 · USA
Yes, that is correct. SERIAL is a unique variable created by IPUMS that does not allow for identifying individuals across sample years. You may be able to find more information on how the original Census serial numbers are constructed on the Guidance for Data Users Page. Moreover, the sampling procedure ensures that no households are included in the ACS for multiple years in a row. Section 4.3 of the ACS Design and Methodology Report notes that the sub-frame used to select addresses into the sample is rotated each year. Since there are five sub-frames in total, the same household comes up for selection into the sample only once every five years.
2022-06-03 · General
If your dataset is restricted to one person per household, it technically doesn’t matter whether you use PERWT or HHWT for your analysis. While HHWT is the intended weight to be used, both will give you household-level estimates. As the ACS Design and Methodology Report (pg. 24) notes, this is because “the housing unit weight is equal to the person weight of the householder.” While technically the weights are not always identical, they are similar enough that the difference in your estimate will typically be “within a tenth of a percent at the county level.”
2022-06-03 · USA
Yes, this is the method Census uses to modify the weights in the multi-year ACS files (see page 28 of the technical documentation). Modifying the weights is technically only necessary if you’re looking to generate population-level totals or incorporate those into your analysis (e.g. the total number of people who are unemployed). It is not necessary to alter the weights when working with population means (e.g. average income).
2022-06-02 · USA
Household serial number and person number can be combined to uniquely identify individuals only within a single sample. Household serial numbers are reused across samples and similar numbers do not indicate that this is the same household. Unfortunately, it is not possible to construct individual-level panel data using the ACS. I recommend taking a look at the CPS (Current Population Survey) which contains many of the same variables as the ACS and is specifically constructed as a rotating panel of households.
2022-06-01 · USA
Hi Chuck,
If you’re trying to migrate your analysis to R, I highly recommend also taking a look at the ipumsr package. You might also find this in-depth webinar helpful in getting started.
2022-05-27 · USA
Unfortunately, this type of analysis cannot be done using the SDA system. There is no function that would set it to calculate sums by households. If you have any issues conducting this analysis in SAS, please let us know!
2022-05-27 · USA
Yes, you can run a similar analysis on the person-level and estimate percentages without needing to use any of the provided weights. This is because each person in your sample of respondents with in-universe values of POVERTY (i.e. POVERTY > 0) will have a weight of 330. Since each household has a 1-in-330 chance of its household head being selected to answer supplementary income questions, each individual also has the same 1-in-330 chance of being in one of these households. Since the weights are identical for all individuals, you can ignore them when calculating percentages and ratios. When estimating totals (e.g. the total number of children living in poverty), each observation will represent 330 people in your estimate.
A couple additional notes:
For your household analysis, you should only keep one individual for each household in your sample. That individual will represent the entire household and will have a weight of 330 since each household has a 1-in-330 chance of having its household head be the sample-line person. Typically the household head (i.e. PERNUM = 1) is kept, but in this case you might be more interested in keeping the sample-line person instead (SLREC = 2) since there might be other variables you’re interested in that are only available for the sample-line person.
If you’re using Stata, you should consider running the svy command together with the subpop option. This allows you not only to quickly drop not-in-universe values of POVERTY since the option defines the subpopulation by varname ≠ 0 and not missing, but it also calculates survey standard errors where your subpopulation is constructed without replacement.
2022-05-26 · NHGIS
Hi Yanmin,
There’s no consistent relationship between block groups and county subdivisions, however, you can calculate populations for subdivisions using blocks. Decennial census data is available on the block level, crosswalks for which you can find on the NHGIS geographic crosswalks page. Each record in the crosswalk identifies a possible intersection between a single source block and a single target block and includes interpolation weights which estimate the proportion of the source zone’s population located in the target zone. You can follow the provided instructions on using block crosswalks to generate data for larger areas, like county subdivisions.
Alternatively, you can find time series data on the county subdivision level using the NHGIS Data Finder tool. Population tables are available both using nominal integration, allowing for study of changes in characteristics of county subdivisions according to their legal definitions, and tables where county subdivisions are standardized to their 2010 versions.
2022-05-25 · General
You should use weights for both samples in order to make your estimates from each source representative of the population that you’re analyzing. The weight variables indicate how many persons in the population are represented by each sample case. This will vary case-by-case and sample-by-sample. You should use PERWT for generating person-level estimates (e.g. the population of each state or the proportion of people under a certain age) and HHWT for household-level estimates (e.g. the percent of housing units that are owned by their inhabitants). You can find more details about weights on the FAQ page and the sample weights page. Apologies for the very delayed response. I hope this information is still helpful for you.
2022-05-24 · USA
To estimate the number of people moving into SF, your control field can remain blank. Control generates multiple tables of results depending on the variable entered. By including CITY, you would create two results tables: one for people living in SF county at the time of the survey and one for everyone else. For the filter field, you’ll want to include codes 31 and 32 for MIGRATE1D (the detailed version of the variable does not have a value for moving between states, but breaks them down into moving between contiguous and non-contiguous states). Thus, your input should look like this:
- Row: year(2012-2020)
Column: blank
Control: blank
Filter: migrate1d(24,31,32,40), city (6290)
To create age categories, you can recode AGE into intervals and add it to the column field. Your input would look like this:
- Row: year(2012-2020)
Column: age(r: 1-15; 16-24; 25-39; 40-54; 55-64; 65-99)
Control: blank
Filter: migrate1d(24,31,32,40), city(6290)
Migration out of SF would then be:
- Row: year(2012-2020)
Column: age(r: 1-15; 16-24; 25-39; 40-54; 55-64; 65-99)
Control: blank
Filter: migrate1d(24,31,32,40), migplac1(06), migpuma1(7500)
You shouldn’t need to create a new variable to run this analysis. One thing I do want to bring up is that estimates for individual years may be imprecise due to small sample sizes. This is especially true if you’re disaggregating estimates by age. You can see the confidence intervals for your estimates by selecting for them under the Output Options menu. If you would like to get more precise estimates, you can aggregate years into 3 or 5-year groups by recoding the row field to: year(r: 2012-2014; 2015-2017; 2018-2020).
2022-05-19 · General
Hi Chance,
Yes, you should be able to produce state-level estimates using data from the Civic Engagement Supplement of the CPS. Estimates for smaller geographic units or specific subpopulations for which there are few respondents may have high standard errors. However, I doubt you’ll encounter this issue for state-level estimates. IPUMS doesn’t provide any R code specific to this supplement, but I recommend using the survey and srvyr packages. In fact for this case, the weighted.mean() function should suffice for generating your estimates. You may also find the ipumsr package useful for other types of analyses with IPUMS data in R.
2022-05-19 · Health Surveys
Hi Tashir,
You’re in luck! The NHIS team plans to add the 2020 sample to OCC and IND as part of an upcoming release closely following the Memorial Day holiday. These variables offer the original, unharmonized occupation and industry codes. As an additional note, the NHIS updated their occupation codes in 2020 to the 2018 SOC (they used the 2010 SOC in the 2018 NHIS) and their industry codes to the 2017 NAICS (they used the 2012 NAICS in the 2018 NHIS). The team also has future work planned to follow best practices to harmonize the updated occupation and industry codes into OCC1995 and IND1995.
2022-05-05 · USA
Hi Tae,
My first recommendation will be to switch your weight to PERWT. While CITY and CINETHH are both household-level variables, your analysis focuses on older adults (i.e. individuals). You would use HHWT if you were instead calculating the number of households with/without internet access (in that case you would need to edit RACHSING and AGE to be household-level variables as well). However, with PERWT, your statistic will be the number of people living in households with/without internet. For Latino/Hispanic older adults, you’ll want to change the control field to RACHSING(5). Please keep in mind that RACHSING reassigns people who report multiple races to a single race using methods similar to those in Ingram, et al. (2003) as described in the variable page. For your last statistic, you will want to replace your control field with poverty (r:1-199"below"; 200-*“above”). This will result in the system displaying two output tables. The first will be for those making below twice the poverty threshold and the latter will display estimates for those making at least twice above it.
I hope that helps!
2022-04-27 · USA
Hi Frederick,
Sorry to hear that you’re having difficulties with the website. I hope I can help guide you through it and explain how to get your data.
My recommendation would be to use IPUMS CPS. The Census Bureau strongly advises against comparing results from the 2020 American Community Survey (ACS), which is available on IPUMS USA, with those from previous years. This video tutorial will guide you through the steps of creating your extract. You will first need to select your samples. The page automatically defaults you to a set of samples, but you should select to compare the 2020 and the 2021 ASEC. The ASEC is the Annual Social and Economic Supplement of the CPS that is conducted every March and includes a larger sample than the basic monthly surveys. You also have the choice to switch at the top of the page between a cross-sectional and longitudinal sample. The longitudinal sample will be smaller since it only includes people who appeared in both ASEC years, but it will more easily allow you to restrict your analysis to the same people over time.
It sounds like the variables you’ll be most interested in adding to your extract are FTOTVAL (total family income), INCTOT (total personal income), and the components of income such as INCWAGE (wage & salary income) and INCINT (income from interest). This page lists all of the income variables that are available from the CPS. Once you’ve added your sample and variables, you can select to view your cart and create an extract. On the extract request page, you can choose different data formats to let you import your extract into Stata, R, SAS, SPSS, or Excel. Another option is to analyze the data online without needing to create an extract using our SDA tool. There, you will want to select the Means tab and make sure to filter by YEAR(2020-2021).
Please follow up if you encounter any questions or problems in getting your data.
2022-04-27 · USA · marked as solution
Hi Jacob,
Thank you for your patience on this. After further discussion, our conclusion is that you do not need to use either HHWT or SLWT to calculate percentages of single-mother households below the poverty line since each household has the same probability of being in the universe for POVERTY. Let me explain. Each person in the 1950 census had a 1-in-330 chance of being selected as a sample-line person in the public use sample of the 1950 census. Once selected, their entire household would join them in the public sample. However, only in the case where the sample line person was the head of the household would they answer the supplementary income questions that are necessary to construct POVERTY (this is noted in the variable universe). The paradox is that the more members the household has, the more likely it’s included in the public use sample. However, the larger the household the less likely the person who was selected was the household head.
Consider 165 families of 2 versus 55 families of 6 in a sample of 330. In the first case, 165 families each have a 1/165 chance of being selected. Once they are, their head is selected with probably 1/2, so the likelihood of a given household head being selected is 1/165 x 1/2 = 1/330. In the second case, 55 families each have a 1/55 chance of being selected. Once they are, their head is selected with probability 1/6, so the likelihood of a given household head being selected is 1/55 x 1/6 = 1/330. The higher chance of their household being selected is exactly offset by the lower chance of the head being selected within the household. Therefore, each household has an equal likelihood of their head being selected (i.e. 1/330).
Since the probability is the same for all households, there is no need to use weights for generating averages since you would be multiplying your household sums by the same constant. If you’re interested in estimating population-level totals, such as the total number of female-headed households, you will want to multiply the number of households you find satisfying the criteria by the inverse of the probability of being included in the sample (i.e. 330). HHWT should only be used to analyze household-level variables that are available for all households (e.g. geography, household composition). Using HHWT for POVERTY will give too much weight to smaller households which have a high probability of having their householder be the sample line person. As an additional note, you should consider dropping all households with multiple families (FAMUNIT). POVERTY is calculated based on family, rather than household, income. A household refers to a residence, which may have unrelated individuals living among several families. If so, POVERTY will only provide information on the family that the household head belongs to. Dropping these households will make sure the family definition in POVERTY is congruent with your household analysis.
Please let me know if you have any further questions. This is a complicated issue and we appreciate you bringing it up so we can provide clear documentation for future users.
2022-04-26 · Time Use
This is unfortunately a result of messiness in the data. This kind of disconnect occurs with other variables in the ATUS such as travel activities and locations as mentioned in this blog post. Please note that blank responses do not imply the individual performed the activity alone. There is a separate code that’s reported for this case (100) as opposed to when a response is blank (9998). It seems that the presence of blanks for this activity indicates missing data. The 2019 ATUS codebook marks these cases using the variable TRWHONA. There are 35,288 such entries in the 2019 BLS microdata file, which matches the number of blanks in the 2019 IPUMS Time Use sample. The ATUS user guide notes that “ATUS collects information (“who” codes) on the person(s) in the room with or accompanying the respondent during his or her activities, yet several activities are ineligible for a “who” code assignment.” However, education does not fall into one of these ineligible activities. The guide further states that “no imputation is performed on missing “who” codes”, suggesting these are simply “missing” codes.
To address the issue of people reporting being alone while taking classes, I checked the location of the activity to see if these respondents were remote students. However, the majority reported being at school while taking classes. A likely scenario is that some respondents implicitly excluded their classmates and instructors while others included them. That would explain why you’re seeing a mix of answers. I wish I could have given a more definitive response, but this is often the nature with survey data.
2022-04-21 · USA
Hi Cela,
If you could tell me which industry and state you’re looking at, I might be able to provide more targeted support on documentation and potential data sources. Generally speaking however, estimates of a small subpopulation using the CPS & ACS will have a large variance due to fewer observations being drawn from it. In your case, it seems the issue is coming from trying to produce statistics on either too small of an industry or state. There are also a few differences between the surveys, such as the ACS including the institutionalized population, which are discussed in this fact sheet.
One way to increase the sample size of your estimates is to pool multiple samples together (i.e. across multiple years of the ACS and CPS ASEC). This will increase the number of observations in your data and the statistical precision, but will limit the temporal precision of your analysis. Note that if you do pool together multiple samples you will need to adjust the sampling weights so that they properly account for the combined samples. An approximate way to do this is to divide the sampling weight by the number of samples you are pooling together. Another option to increase statistical precision is to aggregate multiple similar industries together within a given year.
You might also be interested in using estimates from the BLS’s Current Employment Statistics surveys rather than the ACS or CPS. Though technically smaller than the ACS, this survey of employers may provide a wider and more representative picture of employment on the industry level.
2022-04-20 · CPS
If the statement from the technical documentation on income data also includes data on non-cash benefits, then it would imply these are annual amounts based on the previous calendar year. There is however a specific note in the 2015 ASEC documentation which mentions that FHOUSSUB is a monthly amount. I assume that this is a monthly average derived from the previous calendar year, but the documentation isn’t explicit on this.
Apologies for the delayed response.
2022-04-15 · International
Hi Joana,
The Bangladesh 2021 Census is not in the current list of candidate censuses. Unfortunately, it will not be part of the upcoming 2022 release. I hope that’s helpful information.
2022-04-15 · CPS
I was not able to find any explicit information on the reference period for family market value variables. However, the 2021 ASEC technical documentation states that “data on employment and income refer to the preceding year, although demographic data refer to the time of the survey.” Since non-cash benefits are a type of income, my understanding is that they function similarly to other income variables in that the reference period is the previous calendar year. Another hint this is the case is that both universes for FOODSTAMP (F_MV_FS in the ASEC documentation ) and SCHLLUNCH (F_MV_SL) are derived from variables that reference the previous calendar year. This case however is less clear for HOUSSUB since the value reported is a monthly amount.
2022-04-12 · CPS
This family interrelationship page provides more detail on SPLOC, which was created by IPUMS to help better identify spouses and partners over time. In particular, the page notes that SPLOC “links married and cohabiting relationships for same-sex and opposite-sex couples.” It is therefore not the case that every person who has a non-zero value for SPLOC is necessarily married. Specifically, if an individual has RELATE = 1116 or 1117, then that unmarried cohabiting partner and the householder will be linked through SPLOC with an SPRULE value beginning with 2. Those are the only cases where an unmarried individual should have a nonzero value for SPLOC.
2022-04-08 · International
Hi Chun Chee,
The universe for EDUCMY notes that all persons in the census should have a value for this variable. In the process of harmonizing variables across multiple sample years, different responses may be grouped under the same heading. There is an option to explore how IPUMS created this variable at the bottom of the codes tab for EDUCMY. This will lead you to a harmonization table which shows how responses were recoded by IPUMS. The 2000 Census seems to have grouped all post-secondary education (Form 6, GCE A Level, Matriculation) into one category that IPUMS labeled Form 6 with certificate [completed] . Therefore, in the 2000 sample, this category includes both public and private school attendees. However, there does not seem to have been an option for respondents to indicate they attained A levels in samples prior to the 2000 census. If there were such individuals, they would still have been required to provide their level of educational attainment based on the response choices given to them.
I hope this helps!
2022-04-07 · CPS · marked as solution
IPUMS family interrelationship variable SPLOC provides the person number (PERNUM) of the respondent’s spouse based on an IPUMS algorithm which incorporates responses to RELATE, SEX, AGE, and occasionally order information. You can find more details on how spouses are matched on the SPRULE variable description tab. SPLOC includes both married and cohabiting same-sex couples. It does not require either individual to be the householder. You can differentiate between married spouses and cohabiting partners with MARST and specifically identify same-sex couples by attaching SEX in the attach characteristics option in the extract request menu. If you’re looking for the original self-reported responses, you can find them in the variables ASPOUSE and PECOHAB.
I hope that helps!
2022-04-07 · CPS
HHDFMX is not available on IPUMS, but you should be able to get the same level of detail that you would get from HHDFMX using a combination of RELATE and family interrelationship variables available on this page. FTYPE will tell you if an individual belongs to the primary family, a related subfamily, an unrelated subfamily, is unrelated to any families residing at the address, or is living in an address with no families. FAMREL provides finer detail on families by distinguishing whether an individual is the reference person, their spouse, their child, another relative, or someone unrelated. Finally, you should be able to use MARST and AGE to get the remaining data that’s available in HHDFMX. As a note, these variables use the Census definition of families, which is different from the one employed in IPUMS-created variables such as MOMLOC, POPLOC, and SPLOC.
2022-04-07 · USA
I should say that this method specifically is to link parents to their children. Linking children to their parent records is a bit more involved and requires you to leverage the variables MOMLOC and POPLOC, which provide the person number of each parent in the household. Combing with SAMPLE and SERIAL will make it so each child will have a unique identifier linking them to their parent. After that, you can simply create new variables for each parent representing their child’s characteristics based on the identifier, although you will want to do this separately for each child. I hope that helps!
2022-04-07 · USA
Hi May,
Yes, you can link children to their parents in both the 2000 Census and in the ACS, but only if they both appear in the same household. When you go to create your data extract, you want to select the Attach Characteristics option. Doing so will let you attach the mother’s, father’s, or both parents’ records to their child, including any of the variables added to your cart. Children in this case refer to biological, step, or adopted children regardless of age. This video tutorial guides you through the process of attaching characteristics. You can take a look at this user guide if you’re interested in the details of how IPUMS constructed these family interrelationships.
2022-04-06 · CPS
Sure thing! I recommend reaching out to Census at dsd.cps@census.gov. They respond to errors in CPS source microdata and can provide more information.
2022-04-01 · Time Use
It can be difficult to tell which samples the AHTUS descriptions refer to. In short, secondary childcare, described as general care of older children in the ATUS portion of the harmonized AHTUS data, is identical to childcare in the ATUS and includes care for all children under age 13.
To calculate how much each person spent on secondary childcare in the AHTUS, you will need to sum TIME for cases where SEC = 34 by IDENT. If you do so however, you will notice there is more secondary childcare reported in the AHTUS than in the ATUS. This is because child sleep and wake time are used in the ATUS to determine total secondary childcare. Thus, if a child went to sleep during a main activity, secondary childcare would only be counted for the portion of the activity for which the child was awake. However, in the AHTUS harmonization process, child sleep and wake times are ignored and the secondary childcare is assumed to extend through the entire duration of the main activity.
2022-03-18 · CPS · marked as solution
The NIU cases you highlighted are present in the original data from the Census Bureau as well; the team looked for potential reasons for this, but did not find a systematic explanation for why these cases are NIU. The IPUMS CPS team will document this in the VOTERESP variable description. I wish I could have delivered a more definitive answer, but I hope that it’s helpful nonetheless.
2022-03-15 · Health Surveys
Hi Adam!
The AHRQ (Agency for Healthcare Research) discontinued offering variables that summarized the total number of visits and expenditures broken out by type of non-physician provider after 2016. Only OBTOTVIS (total visits to medical providers) and OBPHVIS (total visits to physicians) continue to be provided. IPUMS has done preliminary work evaluating whether we can continue the person-level series of visit and expenditure variables by aggregating available event-level data. Things look promising. The MEPS team is hoping to deliver the event-level data later this spring, though it will take at least until the end of the year to fully reproduce these visit and expenditure variables.
However, you should be able to reconstruct these visit variables yourself from the event-level data we release. We’re happy to share Stata code for this. Please email us at ipums@umn.edu if this is something you’d be interested in.
2022-03-11 · CPS · marked as solution
This variable is available on IPUMS CPS for basic monthly data as the unharmonized variable UH_ABSREA_B1 (1976-1993) and UH_ABSREA_B2 (1994-present). The CPS team is not aware of any reason that this was not made a harmonized variable and will plan to harmonize it over all available years in a future release.
Hope the helps!
2022-03-10 · USA
This working paper notes that the 1850 census introduced questions about place of birth. It states that “individuals who were born in a state or territory of the United States (and the small number of individuals for whom place of birth was not reported) were defined as native, and individuals born in a foreign country were defined as foreign born.”
2022-03-10 · USA
Taking a look, it seems that “native” in this case is defined as the opposite of “foreign”. In the document you linked, native and foreign sum to the total population. Moreover, this table groups individuals into native, foreign-born, and having some foreign-born parents. “Native” in this sense refers to native-born (i.e. born in the US). This table shows that the designation “Indian” evolved into “American Indian”.
I hope that helps!
2022-03-02 · USA
Thank you for your patience and apologies for the delayed response. The original Census class of worker (COW) variable is the input for the harmonized IPUMS variable CLASSWKR. The IPUMS harmonization process is designed to facilitate comparability across time while preserving detail that is only available in some samples. The codes assigned to harmonized variables often differ from those used in the original variables. As you noted, CLASSWKR uses a 0 code to denote out of universe cases (for persons who were not asked the question associated with the variable), whereas the original census data have a blank or “.” for these cases. The IPUMS out of universe category (0) includes cases that are blank in the original COW variable (N/A - less than 16 years old/NILF who last worked more than 5 years ago or never worked) as well as persons who indicated they were “unemployed and last worked 5 years ago or earlier or never worked”. We do not, however, allocate the original blank/out of universe to valid CLASSWKR cases.
IPUMS USA also offers the unharmonized source variables (see how to view these below) to allow users to recode the variables differently, and to increase transparency about the relationship between harmonized and unharmonized versions of variables. Below I have included a crosstab of both the detailed version of CLASSWKR (called CLASSWKRD) and the general version of CLASSWKR (which simply denotes out of universe, self-employed, or works for wages) crossed with the original COW variable from the 2019 5-year ACS.
You can toggle between source variables and harmonized variables from the main data browsing page:
I hope this information is helpful and answers your question.
2022-02-18 · General
IPUMS does not provide assistance on analytical questions that do not directly relate to variable or other IPUMS documentation. However, this annotated stata output might be helpful. HWBMIZWHO reports the difference between the child’s BMI and the median BMI of a reference population of the same age and sex, expressed in 100 times the standard deviation. The codes tab for the variable notes that observations coded between 9995-9999 indicate various cases where the actual BMI was not recorded and should be excluded from your analysis.
2022-02-15 · International
The comparability tab for OCC will tell you whether a sample is coded using ISCO 1988, 2008, or using a separate method. For instance, both Armenia and Belarus use the ISCO 1988 classification and are generally comparable with each other. In cases where the same coding scheme is used, but the number of digits differ, you may add zeros to make the values comparable. However, this will result in the same occupations having different codes. Two-digit occupation codes do not provide the same level of detail as three-digit codes and therefore it’s unclear which three-digit code individuals with two-digit codes should map to. My recommendation would be to instead remove a digit from three-digit codes in order to run your analysis on this sample. Alternatively, you may use the general recoded variable, OCCISCO, which uses a single-digit ISCO 1988 scheme.
This forum discussion may also be helpful.
2022-02-15 · USA
In a hierarchical data structure, PERNUM will only be available for individual-level records and HHWT will only available for household records. Therefore, simply summing up HHWT will give you aggregate household-level counts.
2022-02-15 · USA · marked as solution
PERNUM and other individual-level variables are only preselected if you have other individual-level variables in your cart. However, you only selected HHINCOME and FTOTINC, both of which are household-level variables. Therefore, your extract defaults to only showing households, for which PERNUM is unavailable. If you want to include both individual and household data, you first want to add a person-level variable to your extract. Then, when you’re on the Extract Request screen, select Data Structure. This will let you choose whether you want a rectangular (person), hierarchical, or household only data structure. A hierarchical structure will include both household data followed by person-level data for each corresponding household.
2022-02-15 · USA
PERNUM, as well as YEAR, SAMPLE, SERIAL, CBSERIAL, HHWT, CLUSTER, STRATA, GQ, and PERWT, are automatically included in your extract. If you click on View Cart, you should see them included together with other variables you selected. Please let me know if that’s not the case.
2022-02-15 · International
Thank you for this additional information and for bringing this to our attention. You are correct that the decennial census is being replaced with a permanent census conducted on an annual, biennial or triennial basis. The IPUMS International Team has not yet made a decision about the frequency with which they will release the data, but it is on their agenda. With other countries that do ongoing census (or census-like) data collection, the team typically releases a version every 5 years. This will likely be the case with Italy as well and a decision will be made at a later date this year.
2022-02-14 · International
I’m not exactly sure what Italian 2019 census database you’re referring to. IPUMS International publishes data from the decennial Italian census and annual labor force data. The 2001 and 2011 decennial census data is available on the IPUMS International website; 2021 data was only recently collected by the government. Labor force survey data from 2019 is available on the website under the Surveys tab on the Select Samples page.
2022-02-14 · International
There are plans to add this dataset in one of the upcoming releases, possibly between late 2022 and mid 2023. If you have an IPUMS account, you’ll automatically receive an email whenever new samples are added. We’re glad to be able to help!
2022-02-08 · General
This is likely caused by one of two issues: either the file was not completely downloaded or it was incorrectly decompressed.
I would first make sure that wherever you’re downloading the file has enough space for both the compressed file and the uncompressed version (which will likely be several times larger than the compressed one). Make sure the entire file downloads; a weak internet connection can cause the download to stop midway.
Once the compressed file is downloaded, you will need to extract it using a decompression software. For Windows users we recommend 7-Zip. For Mac users, our suggestion is the Unarchiver. If you already have a default decompression program and you’re encountering an error, it’s possible to reassign the default to one of the programs mentioned above. In Windows, this is done by right clicking on the compressed file and selecting 7-Zip in the Open with menu. For Mac users, this is done in the preferences for Safari (Safari->Preferences->General ), or similarly in any other browser you’re using.
If you’re downloading data for multiple countries or years, I recommend additionally breaking this up into multiple smaller extracts (e.g., by country, decade, or region); note that IPUMS International includes a number of 10% samples that require their own extract.
If after implementing all of these suggestions, you’re still encountering this issue, please reach out to us at ipums@umu.edu so we can individually work with you to solve this issue.
2022-02-08 · CPS
While IPUMS doesn’t have variables that reveal who claims whom as a dependent, IPUMS does have an extensive number of family interrelationship variables whose construction is further detailed in this user guide. For your purposes, PELNMOM and PELNDAD (2007-2019), or PELNPAR1 and PELNPAR2 (since 2019), would likely be most helpful. These provide the self-reported person number of the respondent’s parents if they are living together in the same household. It includes biological, step, and adoptive parents. Those relationships are further distinguished in PEPAR1TYP and PEPAR2TYP. These variables, combined with AGE, will hopefully give you a sense of which households are likely to have dependents and who is most likely to claim them. There may also be cases where no parents are reported in the household. For such cases, you may need to use the variable RELATE, which provides the respondent’s relationship to the household head, in order to dig deeper into household relationships.
If you do plan to use pre-2007 data, MOMLOC and POPLOC will give you the IPUMS constructed interfamily relationships for the respondent’s mother and father. We recommend for consistency to use either only self-reported relationships mentioned in the first paragraph or these IPUMS generated variables.
2022-02-04 · USA
I want to preface by stating that altering the individual weights is only necessary if you’re looking to generate population-level totals or incorporate those into your analysis (e.g. the total number of people who are unemployed). It is not necessary to alter the weights when working with population means (e.g. average income).
I am not aware of a citation regarding Jeff’s statement about this being strictly more accurate. However, I can share the logic behind his idea:
If you are calculating a weighted mean with standardized weights, and your observations are i.i.d., then the variance of your estimate is minimized if all the weights are equal. This article on Wikipedia provides more detail. Assuming that the three years of data are samples from the same (unchanging) population, your variance will be minimized if you weight each sampled individual the same. With oversampling, poststratification, and other sampling processes in the ACS, the assumption that the weights are equal over time does not fully hold. However, the “more equal” the weights are, the lower the variance will be.
The Census Bureau recommends dividing the weights by the number of samples you are pooling together (see page 28 of this technical paper); this is the approach Census uses to modify the weights in the multi-year ACS files. Since neither the population size nor sample size change very much over three years of ACS data, the two methods are probably going to give very similar results.
2022-01-31 · CPS · marked as solution
Thank you for bringing this to our attention. After reviewing the documentation a bit closer, I realize you’re correct that the CPS does not survey college students living in dorms. While the CPS technical paper 77 states that group quarters “include college dormitories, retirement homes, and communes”, a few lines down it makes it clear that “as a cost-savings measure, student dormitories are not sampled, since the vast majority of students in dormitories either have a usual residence elsewhere, are not in the labor force, or both.” My apologies for providing incorrect information in my initial response.
My recommendation for using the ACS, on IPUMS USA, to find microdata on college students living in college dorms still stands. College/University student housing is one of the categories of group quarters that are explored in the ACS. According to the technical documentation, college dorms are not surveyed during summer months (May-August). The 2020 ACS gives 56,560 individuals who are either undergraduate, graduate, or professional students (GRADEATT = 6-7) residing in non-institutional group quarters (GQTYPE = 5).
2022-01-28 · General
Migrate5 reports migration across unharmonized administrative units. That might explain the unexpected results that you’re getting since there may be cases in which units that existed 5 years ago do not exist in the current census or where new units were created. To mitigate this issue, you will need to use a map of the unharmonized geographic units to determine what changes were made to that unit (i.e. which administrative unit it was combined with/separated from).
There are a couple ways IPUMS can help you in this process. The first is that IPUMS does provide harmonized migration data on first-level administrative units in GEOMIG1_5.
Second is that though the process of harmonizing data on second-level units is still on-going, there are a few countries for which this process is complete. If you reach out to us at ipums@umn.edu and the country is available, I can share translation tables that would help you in deriving second-level administrative units for migration variables that are consistent over time.
This is a very complicated question, so I hope this answer helps!
2022-01-27 · General
When a user first creates a data extract, an accompanying codebook is provided which explains each variable and the meaning for each corresponding code. You can however look these variables up by using the search tool on the IPUMS USA website. Once you’ve entered a search term, clicking on a variable will bring you to a page with a variety of tabs that provide information on the variable. Here are links to INCWAGE, DIFFMOB, and MIGRATE5. The Codes tab for MIGRATE5 will show that a code of 0 refers to N/A (i.e. the respondent is not in the universe for this variable), 1 refers to Same house, 2 to Moved within state, and so on. You might also find this video tutorial on navigating variable descriptions helpful.
2022-01-19 · General · marked as solution
In general, you should use the most restrictive weight for variables included in your analysis, regardless of whether or not those variables are your outcome measure. FSSUPPWT and FSSUPPWTH are the appropriate person- and household-level weights for analyzing food security supplement (FSS) data as these are more restrictive than WTFINL. This is particularly true if you plan on restricting the sample based on FSFDSTMP. If you’re analyzing one of the food security scale variables, then you should use FSHWTSCALE as your weight instead. Additionally, each month, the CPS includes a sub-set of questions asked of the outgoing rotation groups (ORGs). These questions are often called the Earner Study. For analyses that use ORG questions, EARNWT is generally appropriate as it is more restrictive than the FSS weights. Note that this all assumes you are only using data from December; weighting guidance for linking FSS variables to outcomes in other months of the survey is less clear cut.
Hope that helps.
2022-01-19 · International
The GEO2_MX translation table provided at the bottom of the page has the source codes for the municipalities. These need to be matched with codes from MX2000A_RESMUN. Sometimes there are mismatches between the migration codes and the household geography codes. However, since IPUMS International hasn’t begun the harmonization process for Mexico, they are unfortunately unable to help if there are any mismatches. Since the municipality codes from MX2000A_RESMUN are state-specific, once they are matched they need to be combined with MIG1_5_MX from the 2000 census to find the specific municipality.
Hope that helps put you on the right track!
2022-01-19 · USA
For anyone interested in this topic, 1790-1840 census data provides information on the principal city as the lowest geographical detail. Street address and more precise location data is not available.
2022-01-14 · International
Hi Stephen,
Your R code looks correct, but unfortunately the codes for household geography and the municipality of residence 5 years ago have not yet been matched for Mexico. IPUMS is in the process of reconciling household and migration geography and this is a work in progress. Some countries have already been completed, but others such as Mexico will require greater work in matching the codes between MX2000A_RESMUN and GEO2_MX2000. I understand this is probably not the answer you were hoping for, but I hope it’s still useful to know.
2022-01-07 · International
The timeframe has changed somewhat since 2016 and account review and approval now typically take about one week. However, if you haven’t heard back within a week we still ask that you send an email to ipums@umn.edu so we can look into it. Approval takes time as applications to access IPUMS International data have to be reviewed by staff to ensure the proposed research projects are appropriate as per agreements with the original data providers.
2022-01-07 · CPS
This level of disaggregation is possible, but your accuracy will depend on your sample size. Only employed individuals in the outgoing rotation groups of the CPS are asked about union status, which translates to about 10% of the sample in any particular month. Selecting the Case-count view on the Codes page for UNION shows that roughly a thousand respondents in any month are members of a union. Therefore, it’s not surprising that you would have empty cells for unionized workers in a particular state/industry combination. My advice would be to add as many monthly surveys (perhaps even several years of data) into your sample as you feel comfortable with while keeping in mind that certain low population or union-averse states and industries may still have zero unionized members.
2022-01-06 · General
The Census Bureau experienced a backlog and only just recently released the October and November Covid-related questions. IPUMS CPS plans to publish this data in their January 2021 release together with December basic monthly survey data. This typically occurs towards the middle of the month and will depend on when the Census Bureau releases the December 2021 basic monthly data. You can follow updates on the IPUMS twitter as well as on the revision history page.
2022-01-06 · USA
Since 2005, the data published by the Census Bureau has not had separate codes for North and South Korea. Therefore, anyone reporting a birthplace in North or South Korea is coded as being born in “Korea” (BPL = 50200). However, in the 1980, 1990, and 2000 censuses, as well in the ACS between 2001-2004, respondents who stated that they were born in North or South Korea were assigned both the standard code for Korea as well as separate codes in the detailed version of BPL (automatically included in any extract with BPL). One way to see this is to open the Codes tab for BPL and select both “Case-count view” and “Detailed codes”. You’ll also notice that the values for North and South Korea never sum to the total number for Korea as there are some respondents who report just Korea as their birthplace.
I hope that’s helpful
2022-01-03 · USA
The 2020 ACS will be released within the next month or so. As detailed in this post, the data will be experimental due to significant changes in response rates during the pandemic. As a result, the Census Bureau does not recommend comparing estimates using the experimental data with previous years. Further information and guidelines will be added to the IPUMS website once the data is made available.
2021 · 44 replies
2021-12-31 · CPS
The ASEC is the only CPS sample that has variables that deal with healthcare coverage such as PAIDGH (employer group health plan coverage), HIMCAIDLY (Medicaid coverage), HIMCARELY (Medicare coverage), and PHINSUR (private insurance coverage). However, your concern is well-placed that county-level analysis using the ASEC is difficult due to small sample sizes. The reliability of your analysis will depend on the size of the sample and the counties that you include. I suggest referring to the relevant literature for calculating confidence intervals for your statistics to get a clearer picture of the data.
Additionally, as the variable description for COUNTY notes, only 45% of households reside in a county that is identified by name. So while you can do an analysis that uses demographic and income data to predict healthcare coverage, for the majority of households you would only know their state of residence. The list of identified counties with their corresponding codes can be found here.
However, you may also be interested in the ACS (American Community Survey) that is offered through IPUMS USA. Not only are variables dealing with health insurance coverage available, but the larger sample size means that a larger portion of counties are identified.The main drawbacks of the ACS is that it’s only administered once a year and the coverage of healthcare questions is smaller than in the ASEC.
I hope this information is helpful in figuring out which datasets are best for you.
2021-12-15 · Time Use
The Italian Time Use Surveys don’t provide information on the level of monthly net household income or about individual income. The extract system makes it seem that there is data on these variables in the 2008 survey, but in fact all values there are assigned the value -9 (impossible to construct this variable). This is documented on the source documents page. I will see if the Time Use Team can make this more apparent. It’s left unclear whether income data was ever collected in the Italian survey. To find out whether it was and if it can be accessed you will likely need to reach out to the Italian National Statistics Institute.
2021-12-10 · USA
I ran the same exact command on the 2019 ACS and got a value of 328,200,000. Please make sure that when you create your extract that you select “Rectangular (person)” as your data structure and that the “Select Cases” and “Customize Sample Sizes” fields are left unused. Please let me know if after confirming these extract specifications you still encounter problems. I didn’t find an IPUMS account associated with your forum email address, but if you could send an email from the address associated with the account to ipums@umn.edu I can take a look at the extract from our end.
2021-12-10 · International
Hi Michiel,
IPUMS International has not been able to acquire the latest Pakistan census data. As a result, there are currently no plans to add it. IPUMS International is constantly striving to connect with NSOs around the globe. If you have any close contacts in the Pakistan NSO, please let me know at ipums@umn.edu so that the team can get in touch with them.
2021-12-01 · CPS
If children have gone to college or for any other reason are no longer living at home, data on their educational outcomes or place of residence will not appear in the CPS. It is only possible to link this data if they also appear as part of the same household in that survey.
If you’re interested in the educational outcomes of children living within the household, you will need the variable MOMLOC, which reports the person number (PERNUM) of an individual’s coresident mother. Within each household, you can link a mother to her coresident children by associating cases where the children’s MOMLOC value is equal to a woman’s PERNUM value. There is sample code (see endnotes) for how to perform this linkage that may be of interest to you. Note that MOMLOC identifies social relationships (such as stepmother and adoptive mother) as well as biological relationships. MOMLOC will also identify the unmarried partner of a child’s father identified with POPLOC. The method by which probable child-mother links are identified is described in MOMRULE.
Once linked, educational variables such as EDUC, HIGRADE, and SCHLCOLL can help evaluate educational outcomes of interest. The variables COUNTY and STATEFIP report the county and state that the household resides in. However, COUNTY only became available starting September 1995. If you’re looking for a geographic designation below the state level, METFIPS (the metropolitan area of residence) is available for all monthly surveys starting in 1989.
FRRES1-FRRES4 as well as FRRESL provide a bit of knowledge on children who are no longer living in the household through detailing who they are currently living with. These variables are only available for June 1980, 1990, and 1995 and they don’t provide any geographic information.
2021-12-01 · CPS
I took a look at WTFINL and found both cases where the weight increases and where it decreases month-to-month. Chapter 2-3 of Technical Paper 77 describes the process of creating person weights. In summary the five steps include producing base weights under ideal survey conditions, adjusting for non-response, reducing variance for non-self reporting units, benchmarking estimates of the population, and composite weighting. This process is used to produce person weights for each survey month and for this reason they are likely to vary month-to-month due to nonresponse, demographic changes, seasonal effects, and other factors.
I’m not exactly sure how you’re finding that change in industry employment is driven by these weights. Perhaps you’re running a type of decomposition analysis? If so, a change in weights would in fact suggest a change in other factors you’ve mentioned such as shifts from unemployment/nilf into employment or industry transitions. The job of the weights is to make your results representative of the population. It could be that there’s no change in the number of people in the sample who have transitioned industries, but if these people are becoming more representative of the general population then it’s likely that the increasing number of people similar to them who are also transitioning industries are driving your results.
2021-11-24 · CPS
The CPS might not actually treat dorms like prisons. The CPS surveys both family and group quarters and identifies the type of quarters under the variable GQTYPE. The description there notes that “institutions such as college dorms or military barracks are examples of group quarters without families.” If you want to use CPS data you’ll want to be able to additionally distinguish between college dorms and other group quarters without families. SCHLCOLL indicates whether the respondent was enrolled in school or college in the previous week and whether they were enrolled full-time or part-time. Using this in combination with GQTYPE should let you restrict your analysis to college students living in college when surveyed by the CPS.
The ACS, accessed through IPUMS USA, also has data on college students. That survey classifies college dorms into non-institutional group quarters. Student data can be parsed from respondents in similar quarters using GRADEATT. An additional note is that data from the 2020 census is not yet available through IPUMS and we are likely years out from a public release.
Hope that helps!
2021-11-15 · CPS
Certainly! I’m glad it was helpful. This does highlight how sensitive the data we use is to the specific procedures surveys employ. I will try to see if we can get better documentation on these changes.
Feel free to reach out on any further questions you have!
2021-11-12 · CPS
Taking a look at the differences in INCTOT between the ASEC and CPS over the past decade gives us a better view of the trends.
For the ASEC I ran: total inctot if metfips==16980 & individcc==1 & inctot !=999999999 & year == 2005 [pw=asecwt].
For the ACS I ran: total inctot if city == 1190 & inctot !=9999999 & year == 2009 [pw=perwt]
The Census Bureau introduced redesigned income questions in 2014 because ASEC income questions had been previously deemed inaccurate. However, only 3/8 of the sample received the new income questions and 5/8 received the old questions. For this reason, 2014 estimates should be generated by restricting the sample to HFLAG = 1.
The 2016-2019 error looks like a sampling error between the ACS and ASEC. 2009-2013 also look like sampling errors, but with a different mean due to the difference in income questions. That still leaves 2014 and 2015 low estimates unexplained for. I have followed up with our CPS team on this and will let you know when I hear back from them. For now, my recommendation is to use estimates from the ACS. If you are going to use estimates from the CPS, I would analyze the years before 2014 separately from the years after 2015.
2021-11-10 · CPS
LNKFW1YWT is “a longitudinal weight for linking the same month across adjacent years of the CPS.” Therefore, the 2020 1-year longitudinal weights can be used to weigh and link the 2020 ASEC to the 2021 ASEC since they are the same month across adjacent years. Analogously, the 2019 LNKFW1YWT weights can be used to weigh the 2019-20 panel.
The universe for LNKFW1YWT is “those individuals who are eligible to link to the next year”, therefore the 2021 weights would not be helpful for your purpose because they would only be available for those who link to 2022.
2021-11-10 · General
Am I understanding correctly that you’re not seeing any demographic variables when you select an ASEC supplement as your sample? If so, I’m not exactly sure why that might be the case, so it might be best to take this step-by-step.
Once you’re on the IPUMS CPS homepage, you want to hit Get Data and then Change Samples on the top left. That will send you to a page where you can select CPS Basic Monthly surveys and ASEC supplements. In the first screenshot I’ve attached I’ve selected the 2021 ASEC and no Basic Monthly surveys. Please make sure none of the basic monthly samples are selected from the basic monthly tab.
Once you’ve done that, hit Submit Sample Selections. Now you should be able to find demographic variables under Person → Core → Demographics (shown in the second screenshot). If you click on Demographics, you’ll be sent to a page which lists all of the demographic variables and whether they’re available for your sample. The third screenshot I’ve attached shows that all but three demographic variables are available in this ASEC sample.
Please let me know if I’ve misunderstood your question or if your page looks any different.
2021-11-10 · International · marked as solution
What you’re finding in terms of variable availability seems accurate to me. YRIMM (Year of Immigration) is available for 27 different countries, though not all years have data from all of these countries. NATIVITY (whether someone is native-born) and BPLCOUNTRY (Country of Birth) both have much better coverage, though I assume you’re looking for an additional time component to your analysis of cross-country migration. You might be interested in MIGCTRY5 (Country of Residence 5 Years Ago). Though it has a similar sized sample of countries as YRIMM, it also gives you the country information in the same variable.
As to your broader question on whether the IPUMS International dataset is suitable for cross-country research on immigrants, it depends on your research question. As you can see, the data IPUMS-I has on international migration is by no means exhaustive. However, if you are looking to focus on international migration in a specific country, or between a limited set of countries, there might be plenty to work with.
2021-11-09 · USA
This analysis is certainly possible to run using IPUMS USA. To clarify terms, households include everyone who is living in a certain housing unit and therefore there can be multiple families, groups of related people, within a household. Subfamilies are simply families that live in someone else’s household. This page describes in greater detail family interrelationship variables in IPUMS USA.
If you are looking to run your analysis on the family rather than the household level, you should start by creating an extract and adding the variables AGE, SEX, NCHILD (number of own children residing with the individual), SPLOC (their spouse’s person number if they are in the same household), MOMLOC (mother’s person number), POPLOC (father’s person number), MARST (marital status), FAMUNIT (which family in the household the individual belongs to), and FTOTINC (total family income). SPLOC, MOMLOC, and POPLOC may be especially helpful since if any of them are greater than 0 then the individual is living with that family member. I would highly recommend reviewing the Codes, Description, and Comparability tabs for each variable you add. You may find a lot of use in the select cases and attach characteristics tools that are available after creating your data extract from the data cart. You can use the select cases feature to limit your extract to only teenage mothers living with their children using the variables AGE, SEX, and NCHILD. Attach characteristics allows you to attach a variable such as MARST to the individual’s relations, such as their parents.
This video tutorial can be very helpful if you get stuck using the various tools in the IPUMS extract system.
2021-11-09 · NHGIS
Your extract should have included a codebook with a data dictionary that defines all of the selected variables. Checking the codebook, it notes that columns AZ8001 and AZ8002 are the county-level total populations for 1900 and 1910, respectively.
2021-11-04 · CPS
I was not able to replicate your issue using the CPS 2019 ASEC data, but instead got a number very similar to your estimates using the ACS. The code I ran was:
total hhincome if pernum==1 & metfips==16980 & individcc==1 & hhincome<9999999 [pw=asecwth]
One possibility of what might be skewing your results is that you did not drop the observations for HHINCOME that are not-in-universe (HHINCOME = 9999999). I hope this helps.
2021-11-01 · General
All of the supplements are available in the sample selection menu on the IPUMS CPS website. To get to the menu you would hit Get Data on the IPUMS CPS homepage followed by Select Samples on the top left. Once you’re on that page, you want to select Basic Monthly, followed by Supplement Topics, and Voter. There you will be able to select voter supplements from 1976 to 2020.
2021-11-01 · CPS
The sum of INCTOT across SPMFAMUNIT members is equivalent to SPMFTOTVAL. You might be getting different values if you aren’t accounting for observations that are not-in-universe (NIU). INCTOT values of 999999999 do not represent earnings but rather observations that are NIU. The Universe tab for INCTOT shows that these are cases of children under 15 years of age. Dropping these NIU (INCTOT = 999999999) and Missing (INCTOT = 999999998) cases should produce estimates for INCTOT across SPMFAMUNIT that are equivalent to SPMFTOTVAL.
2021-11-01 · USA
Your guess is correct. The ACS does not categorize households by race or hispanic origin. These only appear as individual level variables. PERNUM equal to 1 only refers to the first person who appears in the survey and does not imply anything about the remaining household members. Therefore, if there are members of a household who differ in race or ethnicity, then the value for the variable will also differ by PERNUM.
2021-10-26 · Health Surveys
This variable has been harmonized by IPUMS as NOTCARCOST. The sources tab notes that MEDNG12M is the original NHIS variable. If you merge the variables please note that there is a slight difference between the two: YBARCARE asks if the person did not get needed medical care because they couldn’t afford it, whereas NOTCARCOST asks if the person did not get needed medical care because of the cost. The NHIS team will be looking into whether this difference is meaningful and if the variables should be merged. You should also make sure to use the correct corresponding weights (SAMPWEIGHT for the 2019 sample) when running your analysis.
2021-10-19 · CPS
I apologize for the delayed response. You are correct that the documentation is out of date and that the updated principal cities are detailed in the CPS codebooks. The IPUMS CPS team is aware of this and are looking into updating the documentation.
2021-10-19 · CPS
I apologize for the delayed response on our end. The ASEC codebook details that “the weight on the family record is the March supplement weight of the householder or reference person”. Therefore, if you have the pandemic-adjusted weight of the reference person (the person for whom PERNUM = 1), you can use this as the family weight for all individuals within the unit. If possible, I would also recommend reaching out to Rothbaum and Bee and seeing if they created any family weights themselves.
Hope that’s helpful!
2021-10-18 · USA
The program is unable to create this large of a table. BPL details over 500 different codes for birthplaces of individuals. However, the main issue is when POVERTY is added as the column variable. The variable description states that it “expresses each family’s total income for the previous year as a percentage of the poverty thresholds”. Since household income is a continuous variable, there are almost as many values for POVERTY as there are households in the sample, making generating this table unwieldy for the program.
There are several possible solutions to this issue depending on what you want to measure. If you want to see the number of households below and above the poverty line, you can recode the poverty variable. You will want to run your table with poverty(r: 0-100 “Below” ; 101-* “Above”) in the column field. This will divide households into those who are below (or at 100% of) the poverty line and those who are above it (greater than 100% of the poverty line). The syntax is detailed further on the online guide for the SDA tool. You will also want to add an additional filter to exclude cases where POVERTY = 000 since this these observations are not applicable as detailed in the codes tab for the variable.
You might also find this video tutorial helpful if you get stuck.
2021-10-08 · USA
Based on your description, it seems like your level of analysis is on the individual level. As such, there is no need to use HHWT for the county or state. While it is true that these are household-level variables, if you set the data structure for your extract as rectangular, these household geographies will be attached to the person records. That allows you to analyze migration on the person-level using PERWT.
You might find MIGCOUNTY1 helpful in your analysis as it shows the code for the county where the respondent resided the previous year. However, as this blog post explains, county codes are not identified in the ACS. For this reason you might prefer to work with MIGPUMA1 instead. This variable provides you with the area, called the migration PUMA (Public Use Microdata Area), where the respondent resided in the previous year. Unlike MIGCOUNTY1, all PUMAs however are identified in the data, meaning that you will be able to locate the PUMA from where the individual migrated.
2021-10-06 · General
IPUMS does extensive work in constructing probable spouse/partner links such as among unmarried cohabiting couples. SPLOC is the result of this linking work and is used for attaching the spouse characteristics. This page details the rules IPUMS follows in determining the values for SPLOC. Since 2017, SPLOC has linked spouses within same-sex couples and cohabiting couples. All cohabiting couples in the 2019 ACS therefore have a SPLOC value that provides the person number for their spouse, allowing the spouse characteristics to be attached.
2021-10-05 · CPS
Also of note is that not all county codes are identified in the CPS. In fact, only about 45 percent of households in recent years are located in a county that is identified. This is important if in addition to calculating the voter turnout ratio you also want to know the names and locations of the counties in your sample.
2021-10-05 · CPS
It is possible to calculate these turnout ratios using CPS data. However, CPS statistics are not very robust at the county level, especially with a single month of data. I’d recommend looking at studies and seeing the sources they use. This site has helpful guidance on how to estimate voting turnout rates. Some sources you may be interested in are official data from state governments such as this state data from Minnesota.
If you do decide to use CPS data, I would strongly recommend starting by reviewing the Voting and Registration Supplement sample notes so that you’re aware of the peculiarities of this sample. You will have to calculate these county-level ratios using the individual-level data that’s provided in the voter supplement. To find the total black and white population for each county you will want to sum VOSUPPWT for each value of RACE and COUNTY. To specifically find the population that is eligible to vote (i.e. persons age 18+ who are US citizens, including individuals who are native born, born abroad of American parents, or naturalized citizens), you will want to sum the weights only of those who are in the universe of VOTED (i.e. do not have a code of 99). You can then use VOTED again to sum the weights of everyone who answered that they voted by RACE and COUNTY. This will let you derive a voter turnout statistic by race which you can then use to create a black-to-white turnout ratio.
2021-09-27 · USA
The ACS public-use microdata sample (PUMS) contains only the publicly available subset of individuals sampled from the full ACS. The Sample Design section on page 10 of the 2000 PUMS accuracy statement notes that approximately 1-in-4 of all housing units were selected from the ACS for each state through a stratified selection procedure. This is why there are 148,841 households in the PUMS data rather than the 587,519 addresses mentioned in the ACS documentation. In later years this number increases to two-thirds of all cases as described by this Census FAQ.
2021-09-23 · USA
Apologies for the delayed response on our end!
You are correct that the sample sizes for 2000-2004 are smaller than those for later years because of the testing period. If you take a look at the sample descriptions, you’ll see that those years have between a 1-in-750 and 1-in-232 random sample, while all later years have a 1-in-100 sample. However, I am unsure why the number of addresses in 2000 is so much greater than either the number of individuals or housing units in the IPUMS sample. I have forwarded this question to our USA team and will let you know as soon as I hear back.
2021-09-23 · NHGIS
Addresses from the 1940 full-count census are only available by applying for a restricted use license. If you would like to apply for the data, please email ipums@umn.edu with a short description of your research project, including why you require the address data. However, the restricted use versions of the full count data have not been geocoded. If you are looking for a guide on how to geocode this data, the GIS department at Yale provides resources that might be useful. For data that has previously been geocoded, you may want to consider the following two options for the 1940 census:
2021-09-21 · Time Use
TRSPFTPT (full time or part time employment status of spouse or unmarried partner) is currently unavailable from IPUMS. However, it will be made available on the website in a couple of weeks. You can follow IPUMS on Twitter or check the revisions page for announcements of data releases. For the time being I can direct you to SPEMPSTAT (spouse employment status), though this does not have a part-time option, as well as SPUSUALHRS (hours worked by spouse).
2021-09-20 · CPS
After consulting with our CPS team, we think that this is not an issue with MISH or CPSIDP. Rather, it’s a result of MISH being a household-level variable and CPSIDP being on the individual-level. In your second example, the individual does first appear in the July 2021 survey. However, MISH five indicates that July 2021 is also the fifth month-in-sample that occupants in this residence were interviewed. That means that the residence was first surveyed in July 2020, but the first time this individual appears in it is in July 2021. There are a few reasons for such a finding. One possibility is that the individual moved to that residence sometime between November 2020 and June 2021. It could be that they moved in with family already living at the residence. It could also be that the entire previous household moved out and a new household moved in.
Hope this is helpful and please let me know if you have any further questions.
2021-09-10 · CPS · marked as solution
Since you define your sample using the June supplement, the proper weight to use is FRSUPPWT. However, you may also be interested in adjusting for who can be linked across these samples (due to both the rotating nature of the CPS and other factors that affect the sample such as people moving). This requires generating your own weights using iterative proportional fitting (ipf) or raking with FRSUPPWT as the base weight. IPUMS provides sample code for doing so in Stata. You would need to substitute the provided extracts with your own sample months and change the do-file to reflect the months and years that you’re deriving weights for. Feel free to reach out if you have any trouble generating these weights. No other potential sampling biases come to mind, but I would suggest taking a look at the fertility supplement sample notes as well as the universe and comparability sections for your variables of interest to see if there are any other issues you need to consider.
2021-09-03 · General
I think that you haven’t gotten the email verification because of a spam filter that prevents you from receiving it. Were you able to try any of these solutions I mentioned?
Another workaround we can try is linking you straight to your extracts. You’re using NHGIS, correct? If so, you can try accessing your extracts using this link (IPUMS Login)
2021-09-03 · CPS
It is possible to create an extract with both veteran status variables from the March ASEC and variables from the Household Food Security Supplement in December. However, due to the rotating nature of the CPS, only about 25% of the sample from the December supplement will appear in the subsequent ASEC supplement. RoPES can be a helpful tool for identifying the sample size of potential merges between multiple months of the CPS. Cohorts that only appear in one of the two samples will have missing/null values in place of the variables that were asked in the sample they didn’t appear in. For this reason, you might be interested in using a basic version of veteran status (VETSTAT) that is available for all months. If you do decide to continue with merging the December supplement with the ASEC, keep in mind that you will need to use CPSIDP as a key to link individuals between the two sets. Please check the linking the CPS page for more information on this process.
2021-09-02 · General
Hi Jalisa,
I’m glad you were able to reach out over the forum. I received your earlier email and was able to manually verify your address. However, I wasn’t able to reach out to let you know due to a spam filter that bounced my email back. Are you able to receive messages on your email from other senders?
Are you able to login to the website right now without trying to make any tables? If not, my best guess at this point is that your web browser has some outdated cached login information and is using that when you try to download your extract. I have three suggestions. After each, please try downloading your extract again.
- Try to refresh your browser (CTRL + R usually does the trick in most browsers).
- If a refresh doesn’t work, try a “hard reset and empty cache” (details for how to do this across different browsers) and delete any cookies from ipums.org.
- Try using a different browser such as chrome or firefox.
If none of these works, please let me know which browser and the specific version of the browser you are using to help me troubleshoot further.
2021-08-23 · CPS
Hi Kristin,
The Census Bureau does not publish a schedule for when they release the microdata. Once they do release it, the microdata will be updated in IPUMS CPS within about a month. This usually happens in late September or early October. You can view the history of past data releases by IPUMS CPS on the revisions page.
Let me know if you have any questions.
2021-08-18 · USA
Hi Tyler,
For your first question, it sounds like you’re interested in tabular data on metro areas by population size. If so, I’d recommend using IPUMS NHGIS, which provides summary data for targeted geographic areas. You may be interested in this brief tutorial on using the IPUMS NHGIS data finder; I will walk through the steps for how you might find total population by MSA for reference as well. Start by clicking on the “Get Data” button. For Geographical Area you want to select “CORE BASED (METROPOLITAN/MICROPOLITAN) STATISTICAL AREA [2003-PRESENT]” and under Topics you want to select “Total Population”. To get the most recent estimates, you would select 2019 under Years and 2019 ACS under Datasets. Then choose the “Total Population” table.
I’m not sure I understand your second question. Household incomes are the sum of all individual incomes within the household. It isn’t clear to me if you are referring to households composed only of children or simply households with children. Please let me know so I can provide further guidance. However, as it sounds like you are interested in summary data, I would encourage you to check IPUMS NHGIS.
If you are looking to calculate summary statistics using the individual-level microdata in IPUMS USA, you may be interested in the online analysis tool; I am also linking to a brief tutorial on using the online analysis tool and a data training exercise that will provide a guided example of how to use the tool. Note that if you use IPUMS USA, the value labels for the numeric strings associated with specific metro codes will be applied if you read an IPUMS USA extract into a statistical software package. You may also reference the codes lists (e.g., MET2013) to update them on your own if you are not using a stats package; note that not all metropolitan areas are identified in the individual-level microdata available through IPUMS USA.
2021-08-03 · CPS
The page you linked to is correct. It is no longer necessary to go through the intermediate step of using MARBASEC since CPSIDP alone allows you to link the ASEC to other months of the CPS (such as the biennial January job tenure supplement). As Jeff points out, CPSIDP links aren’t perfect and it’s important to verify them using variables such as AGE, SEX, and RACE. I would recommend taking a look at the linking exercises and sample Stata code on this page for further reference. An additional feature to be aware of is that individuals who are part of the ASEC oversample are unable to be linked with the basic survey months and will have a CPSIDP value of 0.
2021-08-02 · USA
That is correct; if you want to produce a statistic representative of the population you want to use HHWT to generate a weighted median of HHINCOME. If you’re using Stata, the pctile command is probably the most straightforward approach as it accepts (frequency) weights. I would also filter your sample by Group Quarters by setting GQ = 1, 2, or 5 so that you’re only including households in your analysis. While most household-level variables are not available for group quarters or for vacant units, this can still help make your results more accurate.
2021-07-28 · USA
When you indicate you took out the top-coded values, I am wondering if you mean that you omitted the N/A values (here coded as 9999999) for HHINCOME, or if you’re referring to the maximum values for the components of personal income, INCTOT. You should be removing the former, but it isn’t clear to me that you would want to remove the latter top-coded values in this situation.
Other than some uncertainty around what you mean by top-coded values, your approach seems fine to me. It would be helpful to have more insight into the estimate you are getting and the source you are comparing it to for average household income. I’m wondering if you are calculating average values for HHINCOME but comparing them to estimates of median HHINCOME since median household incomes seem to be the more common metric in summary statistics. I’m finding an unweighted median household income of $65,000 for San Antonio-New Braunfels, TX, which is close to the $62,000 reported here. High incomes on the tail might be causing the weighted average to significantly diverge from the median. While I wouldn’t expect a large difference (e.g. $30,000), I also wouldn’t expect your estimates from the public use microdata sample (PUMS) available via IPUMS to match Census Bureau estimates exactly because the PUMS data are a sub-sample of the full ACS and have been top-coded.
2021-07-20 · USA
Your thinking on this is mostly correct. However, HHIADJ will only equal to the missing variable code when HHINCOME is missing and NUMPREC is equal to one. My recommendation is to, after creating HHIADJ as specified, input HHINCOME(*-9999998) into the selection filters on the means tab. This will exclude all cases where HHINCOME is missing while also including all negative values of HHINCOME. I suspect the reason that you get slightly different results with your filtering is because you are excluding negative income at the bottom by setting the filter to start at 0. HHINCOME is the sum of the income of all household members taken from INCTOT. You’ll notice that that there are differing bottom codes depending on the sample in question, but they tend to be at negative levels of income. When I did the analysis using the SDA tool for ACS 2001-2019, I got a bottom value of $39,996 for HHINCOME. Additionally, there are no values of HHINCOME between 9999998 and 9999999 since the variable only consists of integers.
Hope that helps!
2021-07-20 · NHGIS
Currently, unincorporated status for census places can be found using the NHGIS data finder tool for 1970 and 1980. There is no separate variable for it. Rather, status is indicated in the place name. Unincorporated place names for 1970 will have a “(U)” after the name to indicate that they are unincorporated. For 1980, unincorporated place names will be followed by a "CDP ‘’ for census-designated place. You want to make sure to select “Place (by State)” and one of the mentioned decennial years in the data finder tool. You will need to also select a source table to proceed to the extract, though any source table (such as total population) will work.
I did some looking on the census website for the other years you had mentioned and found scans of census tables from 1950 and 1960 that indicate incorporated status. IPUMS has not digitized these and I’m not aware if anyone else has.
Hope that helps!
2021-07-19 · CPS
This Census Bureau documentation indicates the variable was discontinued due to security reasons in 2015. The variable was included in the 2012-2014 data initially published by the Bureau, but later pulled with a note about “erroneous tax estimates”. I am not aware of updated versions of these files; as a result IPUMS hasn’t harmonized this variable for the 2012-2014 samples.
Census does provide a short description of how this variable was calculated. If you are interested in calculating this yourself, you may be interested in data on Total Medicaid expenditures and the number of recipients by state; you can use HIMCAIDLY and MOCAID to assign values to individuals.
Hope that’s helpful!
2021-07-15 · General
n.s. stands for “not specified” and refers to cases where more precise information about the place of birth is not available. In your first example, “Americas, ns”, refers to instances when the place of birth was indicated as being in “America” or the “Americas” without any further specification. n.e.c. stands for “not elsewhere classified” and includes all responses for which there is no specific code for the given geography.
Hope that helps!